An Introduction to Life Cycle Assessment
Step-by-step guide to understanding environmental impacts across a product’s life cycle. Learn how to evaluate trade-offs—from raw material extraction through manufacturing, use, and end-of-life—using a structured, science-based method.
Step-by-step guide to understanding environmental impacts across a product’s life cycle. Learn how to evaluate trade-offs—from raw material extraction through manufacturing, use, and end-of-life—using a structured, science-based method.
Step-by-step guide to understanding environmental impacts across a product’s life cycle. Learn how to evaluate trade-offs—from raw material extraction through manufacturing, use, and end-of-life—using a structured, science-based method.
1
What is Life Cycle Assessment?
Life Cycle Assessment (LCA) is a methodology for quantifying the potential environmental impacts of a product or system across its life cycle—from upstream materials and processing through use and end-of-life. In practice, an LCA is a structured model of a real supply chain that helps you understand where impacts come from, what drives them, and what changes will matter most.
What questions does LCA help answer?
LCA helps answer practical questions like:
What is the environmental impact of 1 L of my favourite Dairy Milk? How does it compare to Oat Milk? Almond Milk?
Are greenhouse gas emissions saved when I buy tomatoes from the farmer's market? Versus from international growers?
What is the lifetime impact of electric vehicles vs. fossil-fuel based vehicles? What opportunities are there to reduce this?
LCA results are used by businesses, investors, consumers, and policymakers to evaluate environmental (and often economic and social) trade-offs and to guide decisions with more confidence and transparency.
2
Why do Life Cycle Assessments Matter?
Sustainability decisions are rarely simple. Changes that reduce emissions in one area can increase impacts elsewhere, and “green” claims often depend on boundary choices, assumptions, and data quality.
LCA is designed for this reality. It provides a consistent way to:
define what you’re measuring,
track impacts across the full system, and
compare options using a shared basis (your unit of analysis).
How are LCAs utilized across society?
The Public - LCAs support more informed choices by making impacts clearer and more comparable.
Enterprise - LCAs guide product strategy and operational improvements by revealing impact hotspots.
Supply Chain Managers - LCAs help prioritize supplier engagement and procurement decisions using measured drivers of impact.
Brand Managers - LCAs provide a credible foundation for environmental communications grounded in traceable data.
Retailers - LCAs support product selection and category strategy as customer and regulatory expectations evolve.
Overall, LCAs help teams move from intuition and marketing claims to structured, evidence-based decisions—and they provide the transparency needed to build trust with customers, partners, and regulators.
3
The Life Cycle Assessment Methodology
At CarbonGraph, we like to think of an LCA as a living model of a supply chain: a digital representation of activities and exchanges that can be refined as better data becomes available. You don’t “do an LCA once”—you build a model that can evolve as inputs change, suppliers shift, assumptions are revisited, and uncertainty is reduced.
Practically, practitioners move through the steps iteratively. The process has a clear structure, but real-world modeling is rarely linear.
The Five Steps in LCA
The LCA process is typically broken into five steps:
Step 1: Goal and scope definition
Step 2: Data Collection, Allocation, & Handling Uncertainty
Step 3: Building the Life cycle Inventory (LCI)
Step 4: Life cycle Impact assessment (LCIA)
Step 5: Interpretation of Results & Reporting
You’ll see these steps recur across standards and guidance.
Links to External Methodology Resources
ISO 14040 - Life cycle assessment Principles and framework — https://www.iso.org/standard/37456.html
ISO 14044 - Life Cycle Assessment Requirements and Guidelines — https://www.iso.org/standard/38498.html
ISO 14067 - Greenhouse gases Carbon footprint of products — https://www.iso.org/standard/71206.html
ISO 14025 - Environmental labels and declarations — https://www.iso.org/standard/38131.html
GHG Protocol - Product Life Cycle Accounting and Reporting Standard — https://ghgprotocol.org/sites/default/files/standards/Product-Life-Cycle-Accounting-Reporting-Standard_041613.pdf
U.S. General Services Administration - Life Cycle Assessment Overview — https://sftool.gov/plan/400/life-cycle-assessment
Attributional and Consequential Life Cycle Assessment — https://www.intechopen.com/chapters/69212
4
Step 1: Goal and Scope Definition
This step sets the foundation for everything that follows. A strong goal and scope makes results easier to interpret, easier to explain, and harder to misread.
At a high level, LCAs are often used to support goals like:
Change Management
Use LCA to understand where impacts are generated across the supply chain, then focus improvements where they’ll matter most. This is especially valuable when regulations are evolving or when impact drivers are distributed across many suppliers and processes.
Performance Tracking
An LCA model can be revisited as your product, sourcing, or operations change. That allows you to measure progress over time—using the same structure and assumptions—so that improvements are comparable and traceable.
Stakeholder Stewardship
LCAs provide a shared language for environmental performance. They help you collaborate with suppliers and partners, communicate constraints and trade-offs clearly, and build trust through transparent methods and documented assumptions.
Product Differentiation
When environmental performance is backed by traceable modeling and credible reporting, it becomes a real differentiator. LCA helps teams make claims that are grounded in method and data—not vibes.
Defining the Scope & Boundary Limits of the Product's Life Cycle
To establish the study’s framework, define:
Boundary Limits — what life cycle stages are included
Unit of Analysis — what quantity/function you’re reporting results for (functional or declared unit)
What are the Boundary Limits of an LCA?
Boundary limits determine which stages are included or excluded. Common boundary types include:
Cradle-to-Grave: Full life cycle from extraction through end-of-life. Most comprehensive view.
Cradle-to-Gate: From extraction through manufacturing, ending when the product leaves the factory. Common for material and intermediate products.
Gate-to-Gate: A focused segment of the supply chain, often within a single facility or process step.
Gate-to-Grave: From factory exit through use and end-of-life. Useful when the production stage is not being assessed.
Each choice changes what your results represent—and what conclusions you can (and can’t) draw.
What is the Unit of Analysis of an LCA?
The unit of analysis determines what “one unit” means for your results.
Functional Unit: Tied to what the product does, especially important for comparing alternatives that provide the same function. It typically includes:
Magnitude (quantity/size)
Useful duration (lifespan/number of uses)
Quality parameters (performance specs)
Example: “The LCA was conducted for a 500 ml steel meal container with a silicone lid, designed for 1,000 reuses.”
Declared Unit: A simpler unit based on physical quantity (mass/volume/count), often used when comparability is not the primary goal.
Example: “1 tonne of 68% Fe Ore.”
Unit of Analysis: The amount of product/service the results are based on, derived from either the functional or declared unit.
Starting to Map the Supply Chain
Once goal and scope are set, the next step is to map the system you’re modeling. Think of this as establishing the structure your data will attach to.
A Product Life Cycle Map is a visual representation of stages, activities, and flows across the system boundary.
What is a Product Life Cycle Map?
A Product Life Cycle Map captures the stages of a product’s journey, from upstream materials to end-of-life processing. It helps you understand how activities connect, where key inputs and outputs occur, and where impacts are likely to concentrate.
By laying out the structure, the map helps you identify key exchanges and avoid leaving out important stages.
How do I create a Product Life Cycle Map?
Identify stages across the life cycle (materials, production, distribution, use, end-of-life)
Define boundaries clearly (cradle-to-gate, cradle-to-grave, etc.)
Track inputs/outputs (materials, energy, emissions) at each stage
Visualize interactions between stages so the system structure is explicit
CarbonGraph’s modeling interface is designed to support building—and evolving—these maps over time.
5
Step 2: Data Collection, Allocation, & Handling Uncertainty
Once the structure is defined, you start attaching data to the model. This is where real-world constraints show up: missing data, inconsistent units, supplier variability, and uncertainty.
The quality of your inputs determines the quality of your results—so a key part of this step is being explicit about data quality and gaps.
Why is tracking data quality important?
Identify weak points where data is low-confidence or missing
Assess uncertainty and understand how it influences results
Communicate limitations clearly and traceably
Improve over time by focusing collection on what actually matters
What sources of data can be utilized for the LCA?
Data typically comes from a mix of:
Primary Data Sources
Information collected from production steps within the ownership or control of the reporting company (e.g., measured material weights, facility electricity usage).
Secondary Data Sources
Information not directly measured for the study—such as LCA databases, industry averages, or spend-based estimates.
CarbonGraph also provides a comprehensive set of Reference LCA Data, which is readily accessible to all CarbonGraph users.
What data quality criteria should you consider?
Technological quality: does it match the actual technology used?
Geographical quality: does it match the region/location?
Temporal quality: does it match the relevant timeframe/age?
Completeness: are key inputs/outputs missing?
Reliability: how dependable are sources and methods?
What other data collection challenges are there?
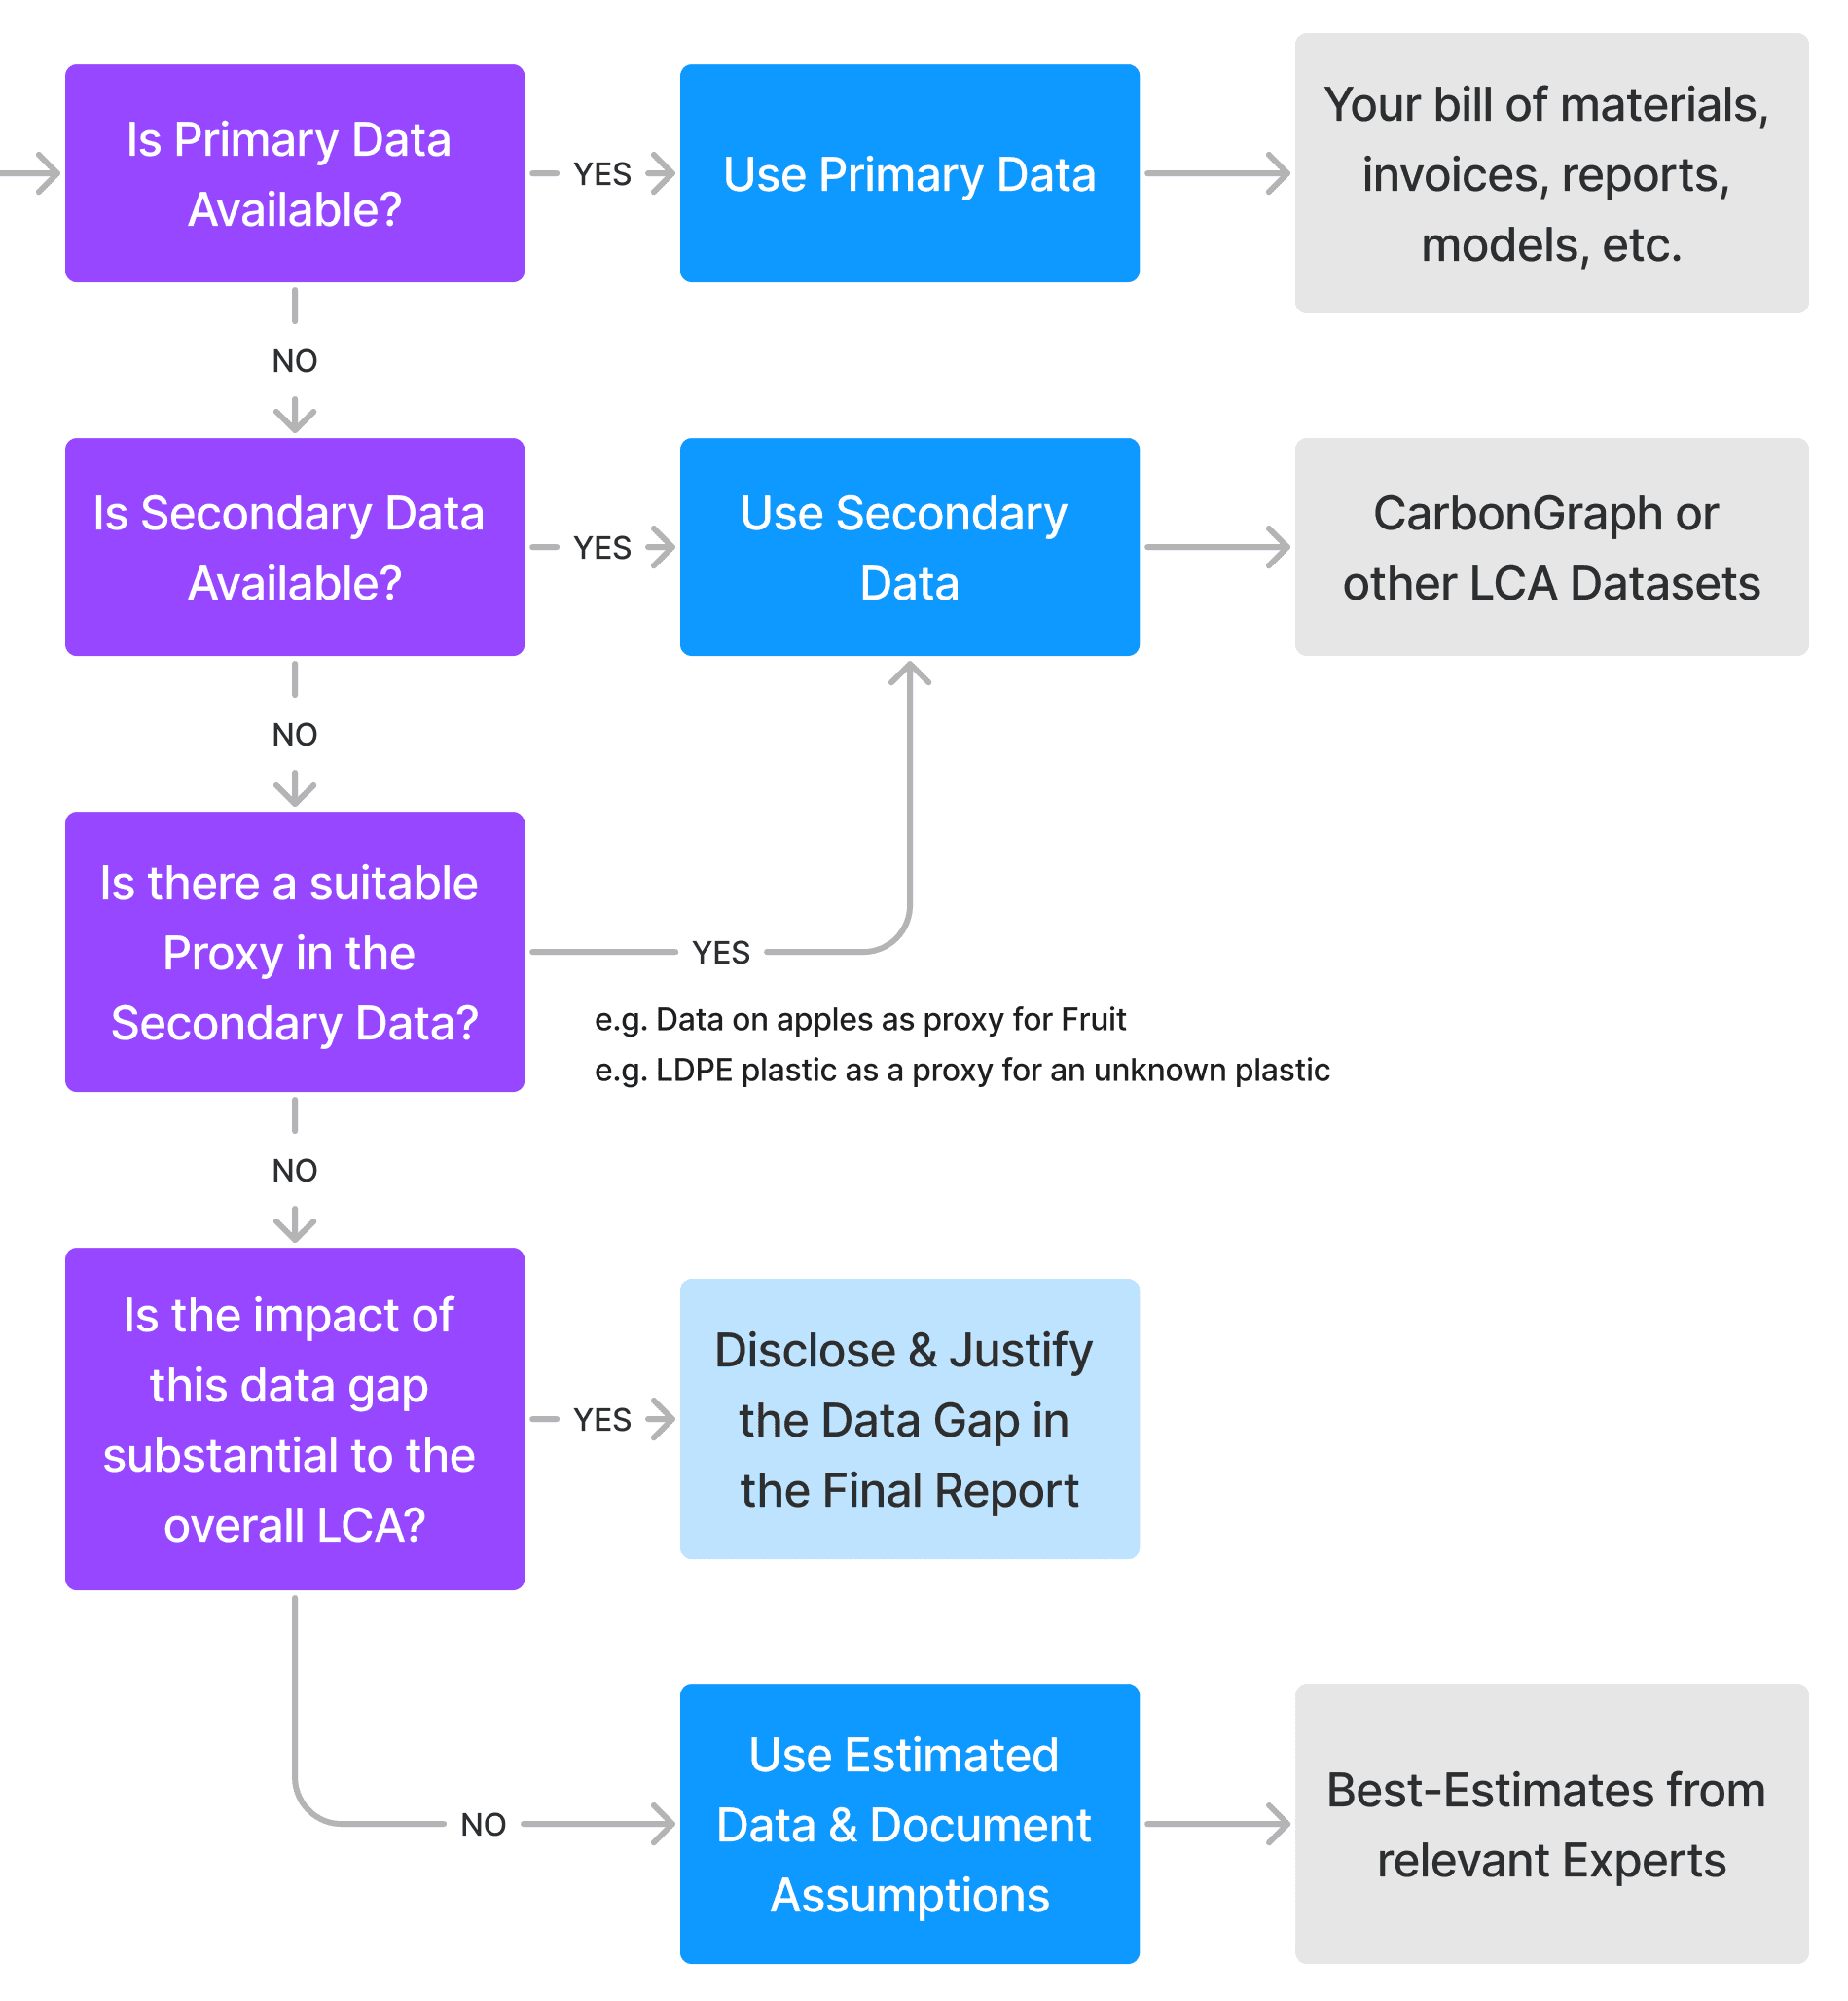
How do I handle uncertainty & fill data gaps?
Data gaps are normal. Primary or secondary data may not be available for certain steps due to confidentiality, limited resources, or poor availability by process or region. Best practice is to document and disclose these gaps—then prioritize improvements where they affect results most.
How do I model & allocate across multiple co-products?
Some production steps generate multiple valuable products, and the shared impacts must be attributed across outputs.
Example: a fish processing facility produces “fish fillets” and “fish by-products” (bones, oils, etc.). What fraction of the facility’s impacts should be associated with each?
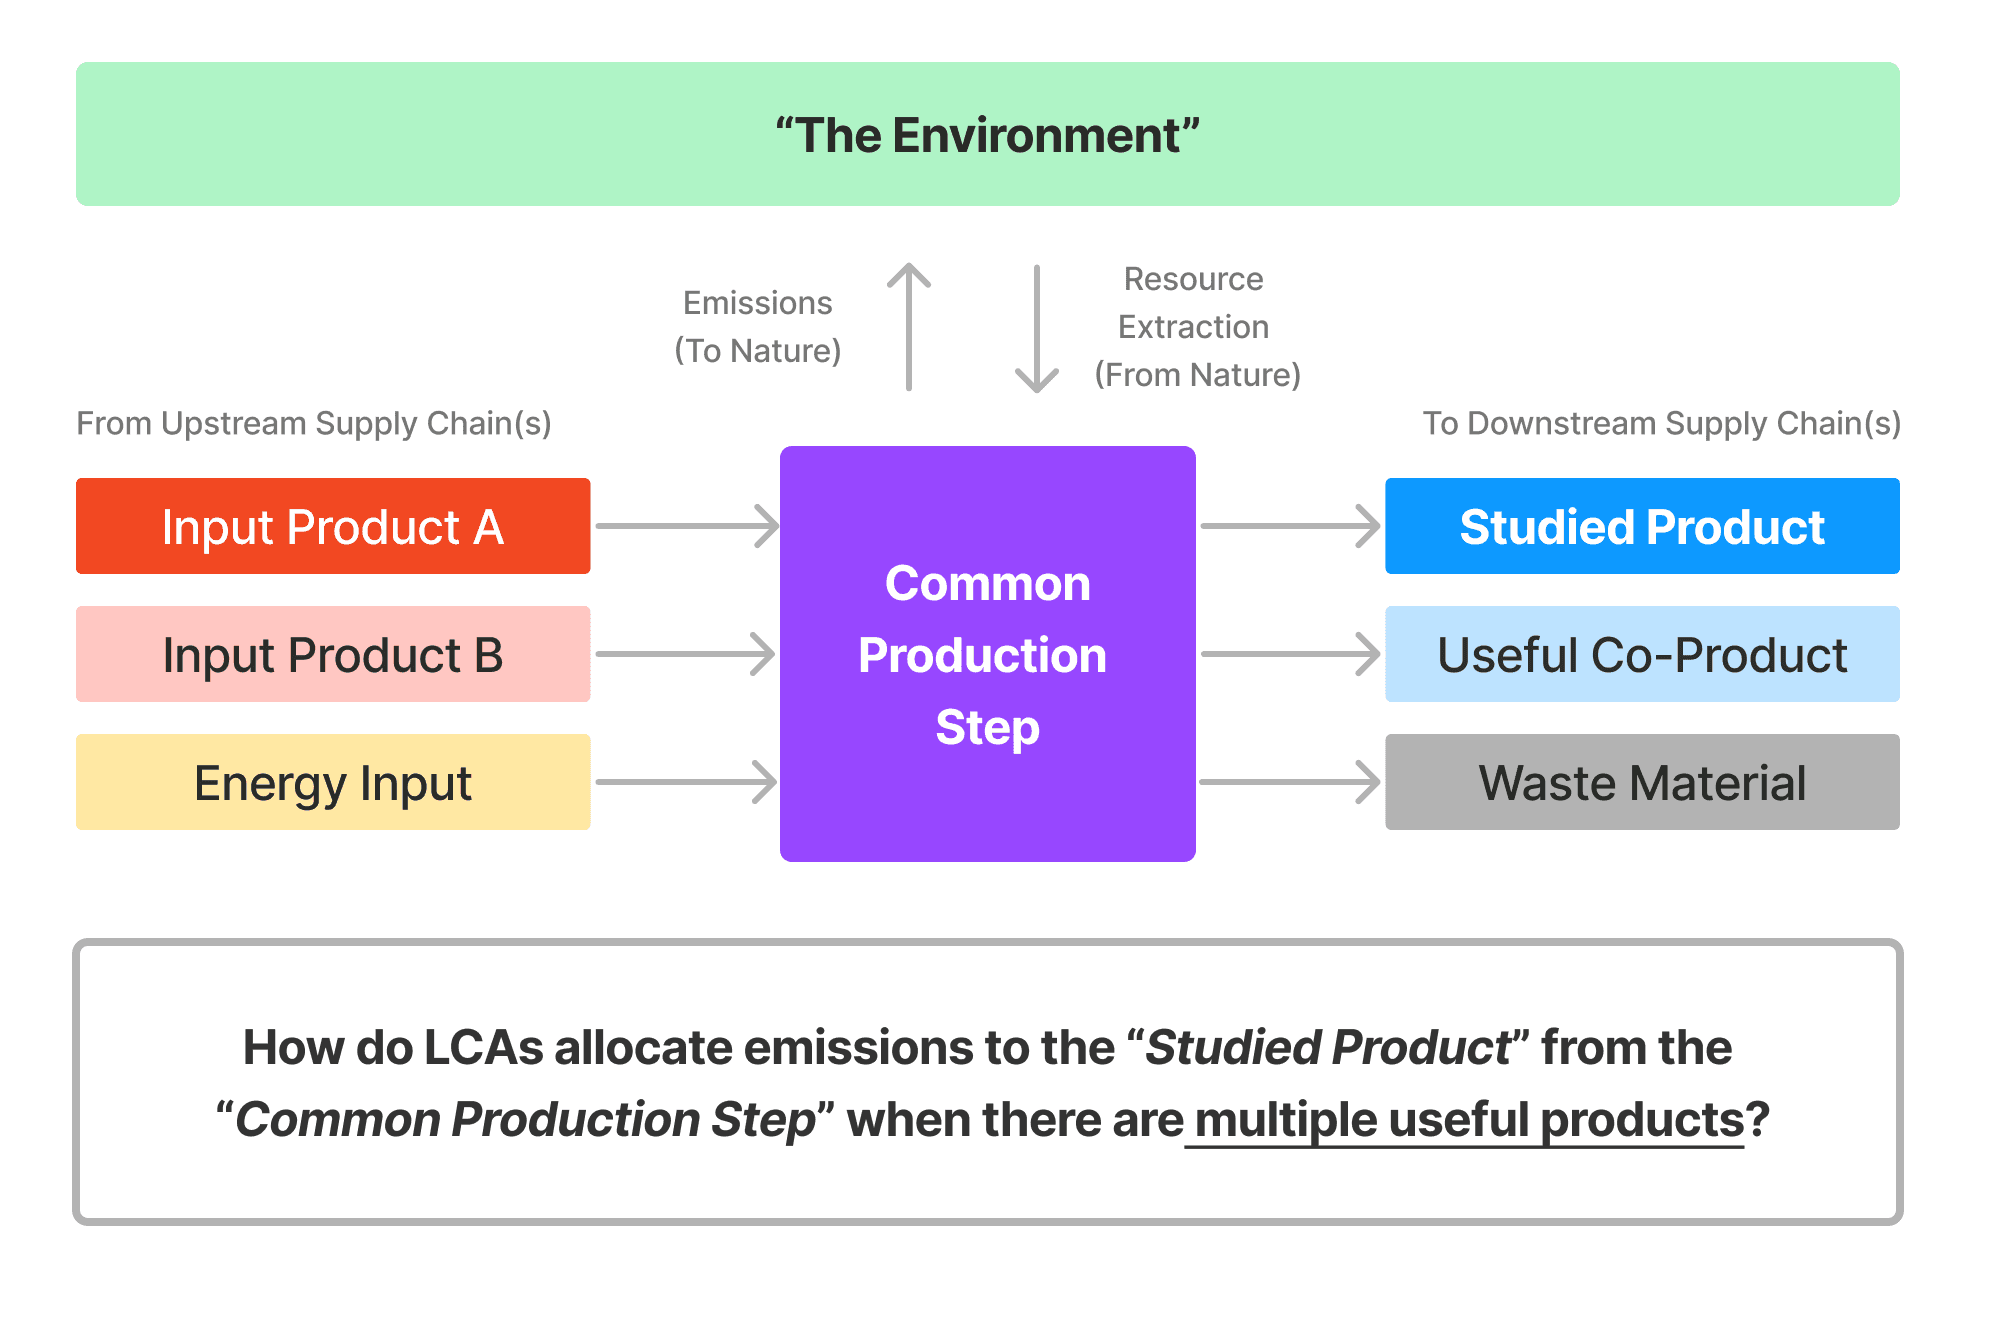
LCA addresses this through allocation.
What are the allocation best practices?
Process Subdivision — Split the process into sub-processes
Functional Unit Redefinition — Combine outputs into a single unit (e.g., egg white + yolk = whole egg)
System Expansion — Model downstream impacts for one co-product
Physical Allocation — Allocate by mass/count/other physical relationships
Economic Allocation — Allocate by market value
Other Relationships Allocation — Allocate using a justified causal relationship
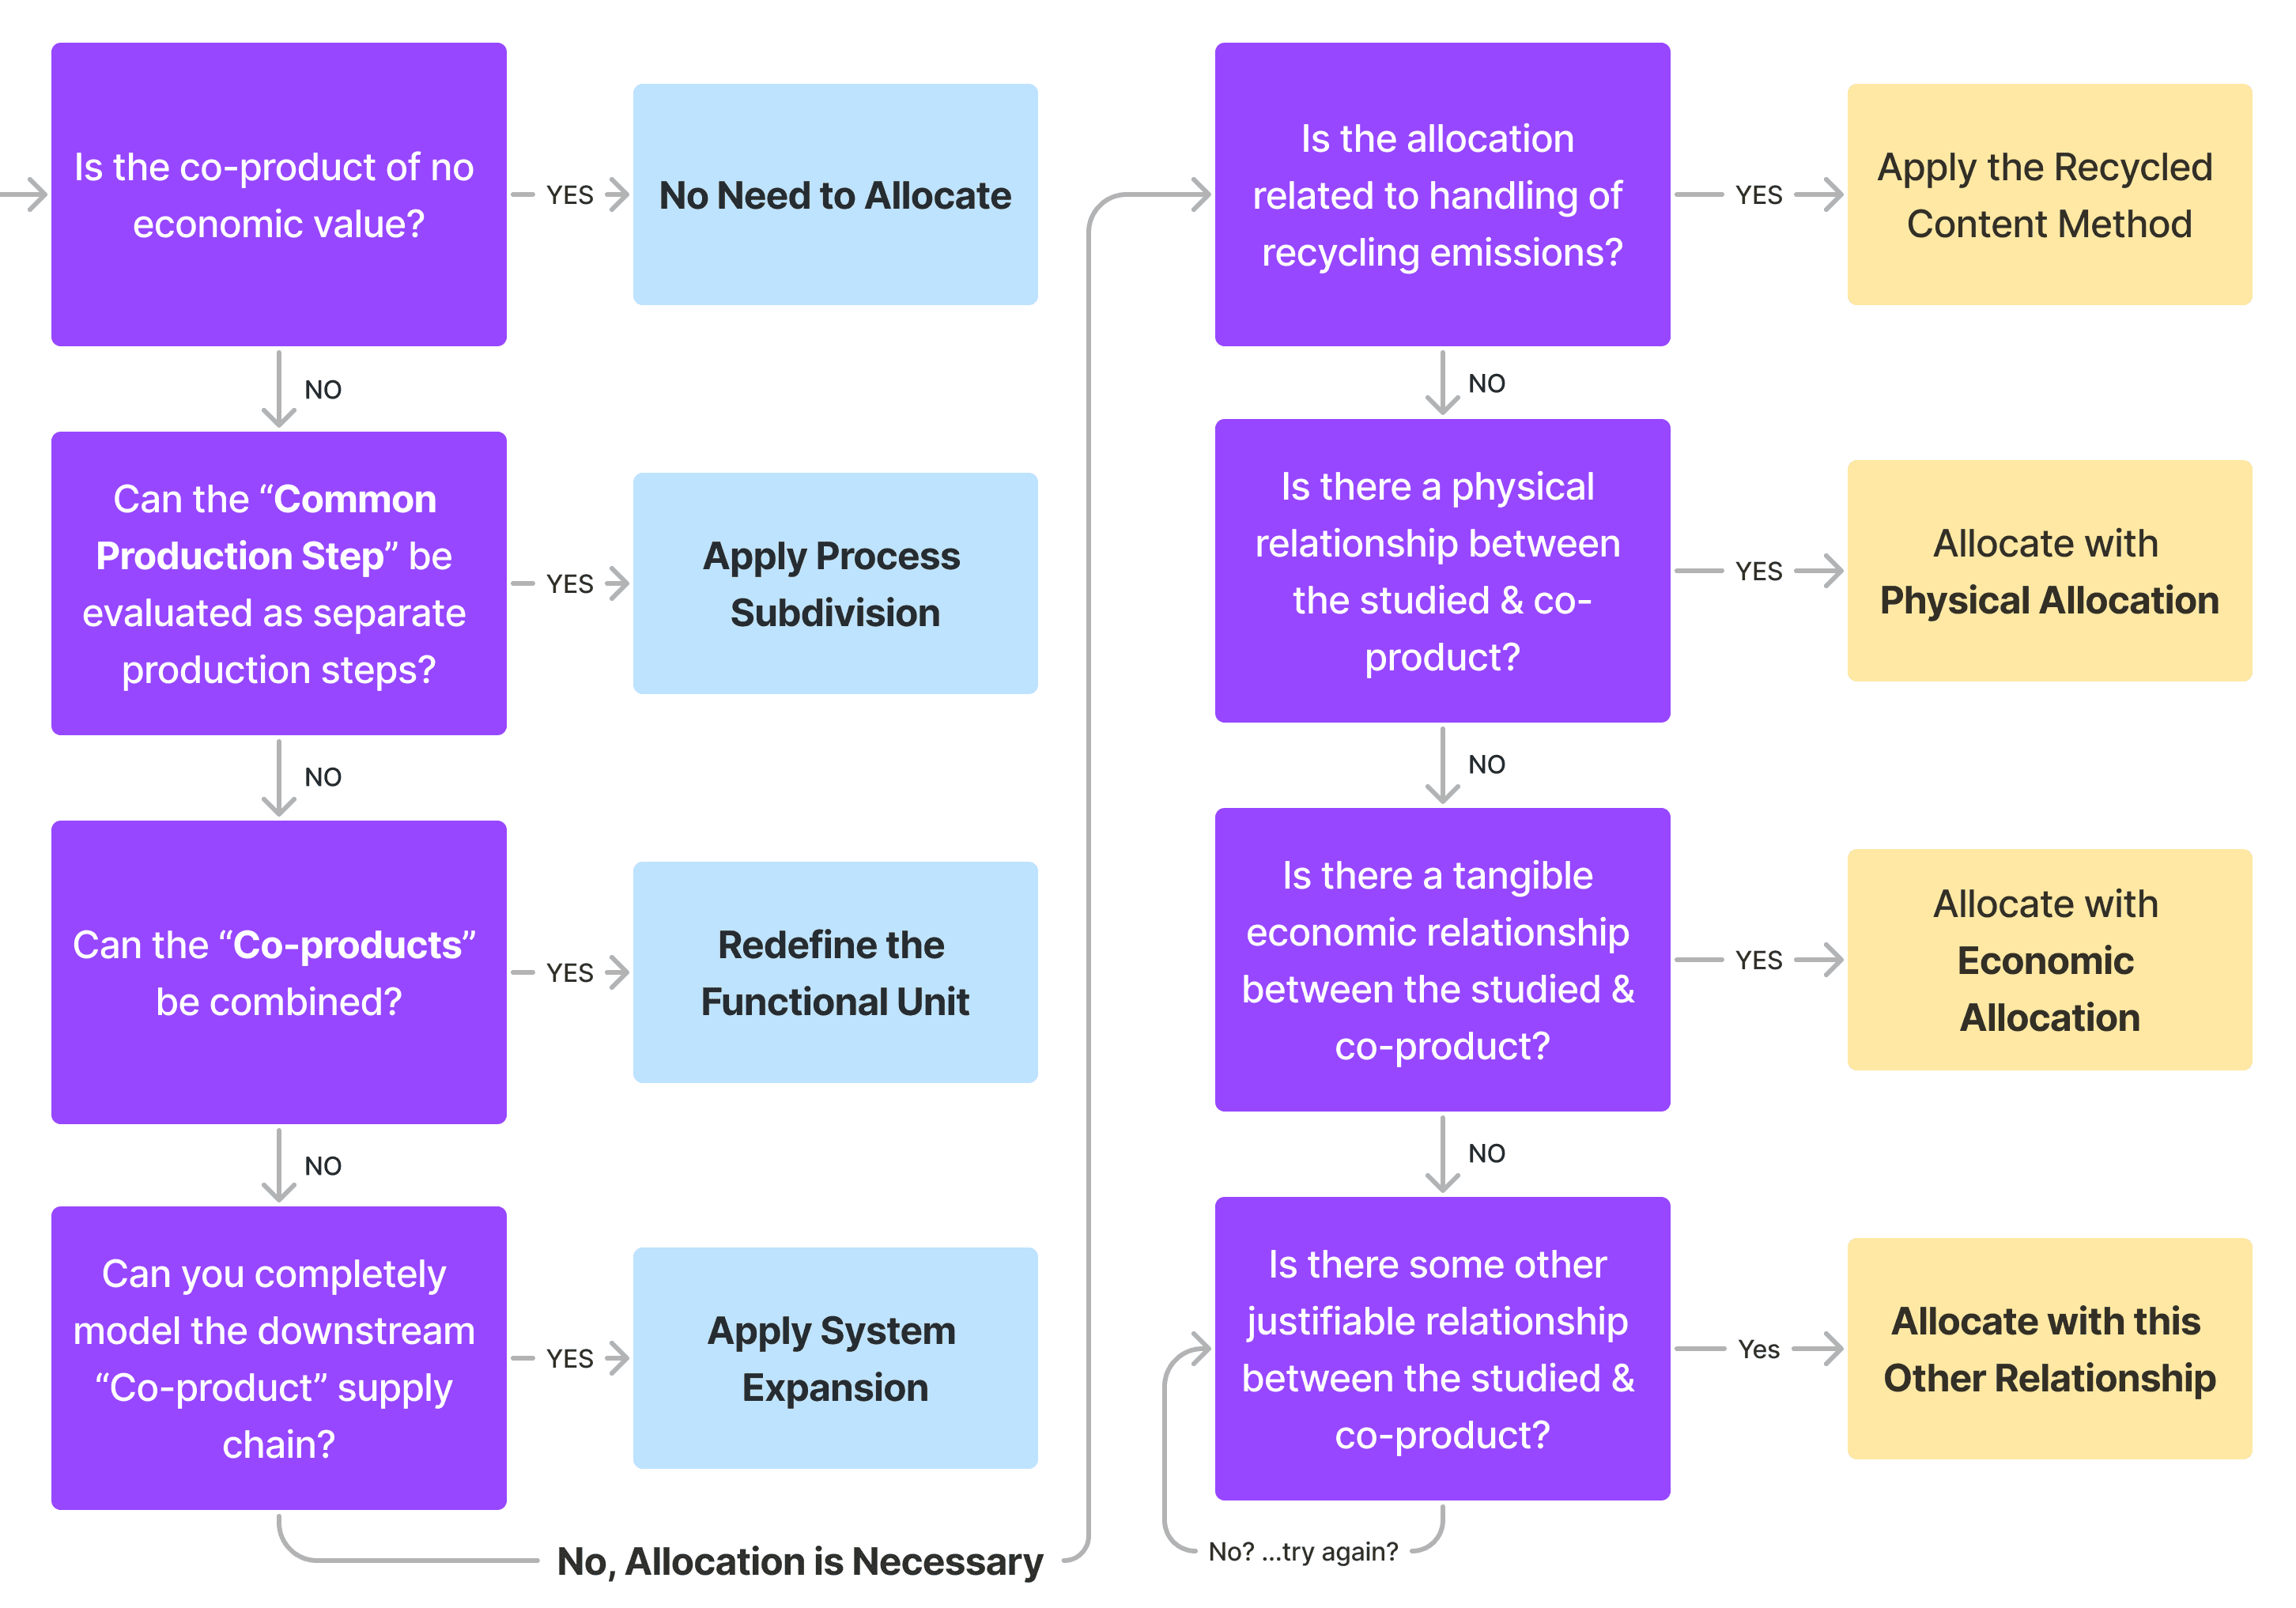
How do I model the use of recycled materials?
Recycling often spans multiple product life cycles, so allocation is required.
CarbonGraph recommends the Recycled Content Method (also known as the Cut-Off Method). This approach attributes recycling impacts to products that use recycled material upstream, and does not assign additional impacts to the end-of-life recycling stage of the product being assessed.
5
Step 2: Data Collection, Allocation, & Handling Uncertainty
Once the structure is defined, you start attaching data to the model. This is where real-world constraints show up: missing data, inconsistent units, supplier variability, and uncertainty.
The quality of your inputs determines the quality of your results—so a key part of this step is being explicit about data quality and gaps.
Why is tracking data quality important?
Identify weak points where data is low-confidence or missing
Assess uncertainty and understand how it influences results
Communicate limitations clearly and traceably
Improve over time by focusing collection on what actually matters
What sources of data can be utilized for the LCA?
Data typically comes from a mix of:
Primary Data Sources
Information collected from production steps within the ownership or control of the reporting company (e.g., measured material weights, facility electricity usage).
Secondary Data Sources
Information not directly measured for the study—such as LCA databases, industry averages, or spend-based estimates.
CarbonGraph also provides a comprehensive set of Reference LCA Data, which is readily accessible to all CarbonGraph users.
What data quality criteria should you consider?
Technological quality: does it match the actual technology used?
Geographical quality: does it match the region/location?
Temporal quality: does it match the relevant timeframe/age?
Completeness: are key inputs/outputs missing?
Reliability: how dependable are sources and methods?
What other data collection challenges are there?
How do I handle uncertainty & fill data gaps?
Data gaps are normal. Primary or secondary data may not be available for certain steps due to confidentiality, limited resources, or poor availability by process or region. Best practice is to document and disclose these gaps—then prioritize improvements where they affect results most.
How do I model & allocate across multiple co-products?
Some production steps generate multiple valuable products, and the shared impacts must be attributed across outputs.
Example: a fish processing facility produces “fish fillets” and “fish by-products” (bones, oils, etc.). What fraction of the facility’s impacts should be associated with each?
LCA addresses this through allocation.
What are the allocation best practices?
Process Subdivision — Split the process into sub-processes
Functional Unit Redefinition — Combine outputs into a single unit (e.g., egg white + yolk = whole egg)
System Expansion — Model downstream impacts for one co-product
Physical Allocation — Allocate by mass/count/other physical relationships
Economic Allocation — Allocate by market value
Other Relationships Allocation — Allocate using a justified causal relationship
How do I model the use of recycled materials?
Recycling often spans multiple product life cycles, so allocation is required.
CarbonGraph recommends the Recycled Content Method (also known as the Cut-Off Method). This approach attributes recycling impacts to products that use recycled material upstream, and does not assign additional impacts to the end-of-life recycling stage of the product being assessed.
6
Step 3: Building the Life Cycle Inventory (LCI)
The Life Cycle Inventory (LCI) is the structured list of inputs and outputs for each production step in your model. If the life cycle map is your blueprint, the LCI is the bill of materials and exchanges that make it real.
A useful way to think about LCIs is as “recipes” for production activities. They can be detailed or high-level depending on what you need the model to represent.
Examples:
200g Flour + 100g Water + 5g yeast + 30 min in the Oven = ~200g of Bread
2 units of Laces + 2 units of Unlaced Shoes = 1 pair of Laced Shoes
500 kWh of Electricity + 1 tonne Scrap Metal = 1 tonne of Liquid Steel
Each input and output is an exchange. Exchanges typically fall into two categories: Elementary and Product Exchanges.
What are Elementary Exchanges?
Elementary exchanges are direct flows between the economy and the environment: resources extracted from nature and emissions/waste released back to nature.
Examples: 1 kg of CO₂ emitted to air, or 1000 kg of iron ore extracted.
What are Product Exchanges?
Product exchanges are human-made materials/services exchanged between production steps within the economy (sometimes described as the “technosphere” or “market”).
Examples: butter, grapes, steel plate—processed goods transferred between stages.
How do LCIs of individual activities become a complete LCA?
A full supply chain model is built by connecting LCIs across production steps. The “right” structure depends on the life cycle map created during goal and scope.
CarbonGraph’s LCA editing interface supports this structure with unit conversions and easy linking between LCIs, enabling complex supply chain models.
Example LCI in the CarbonGraph Platform
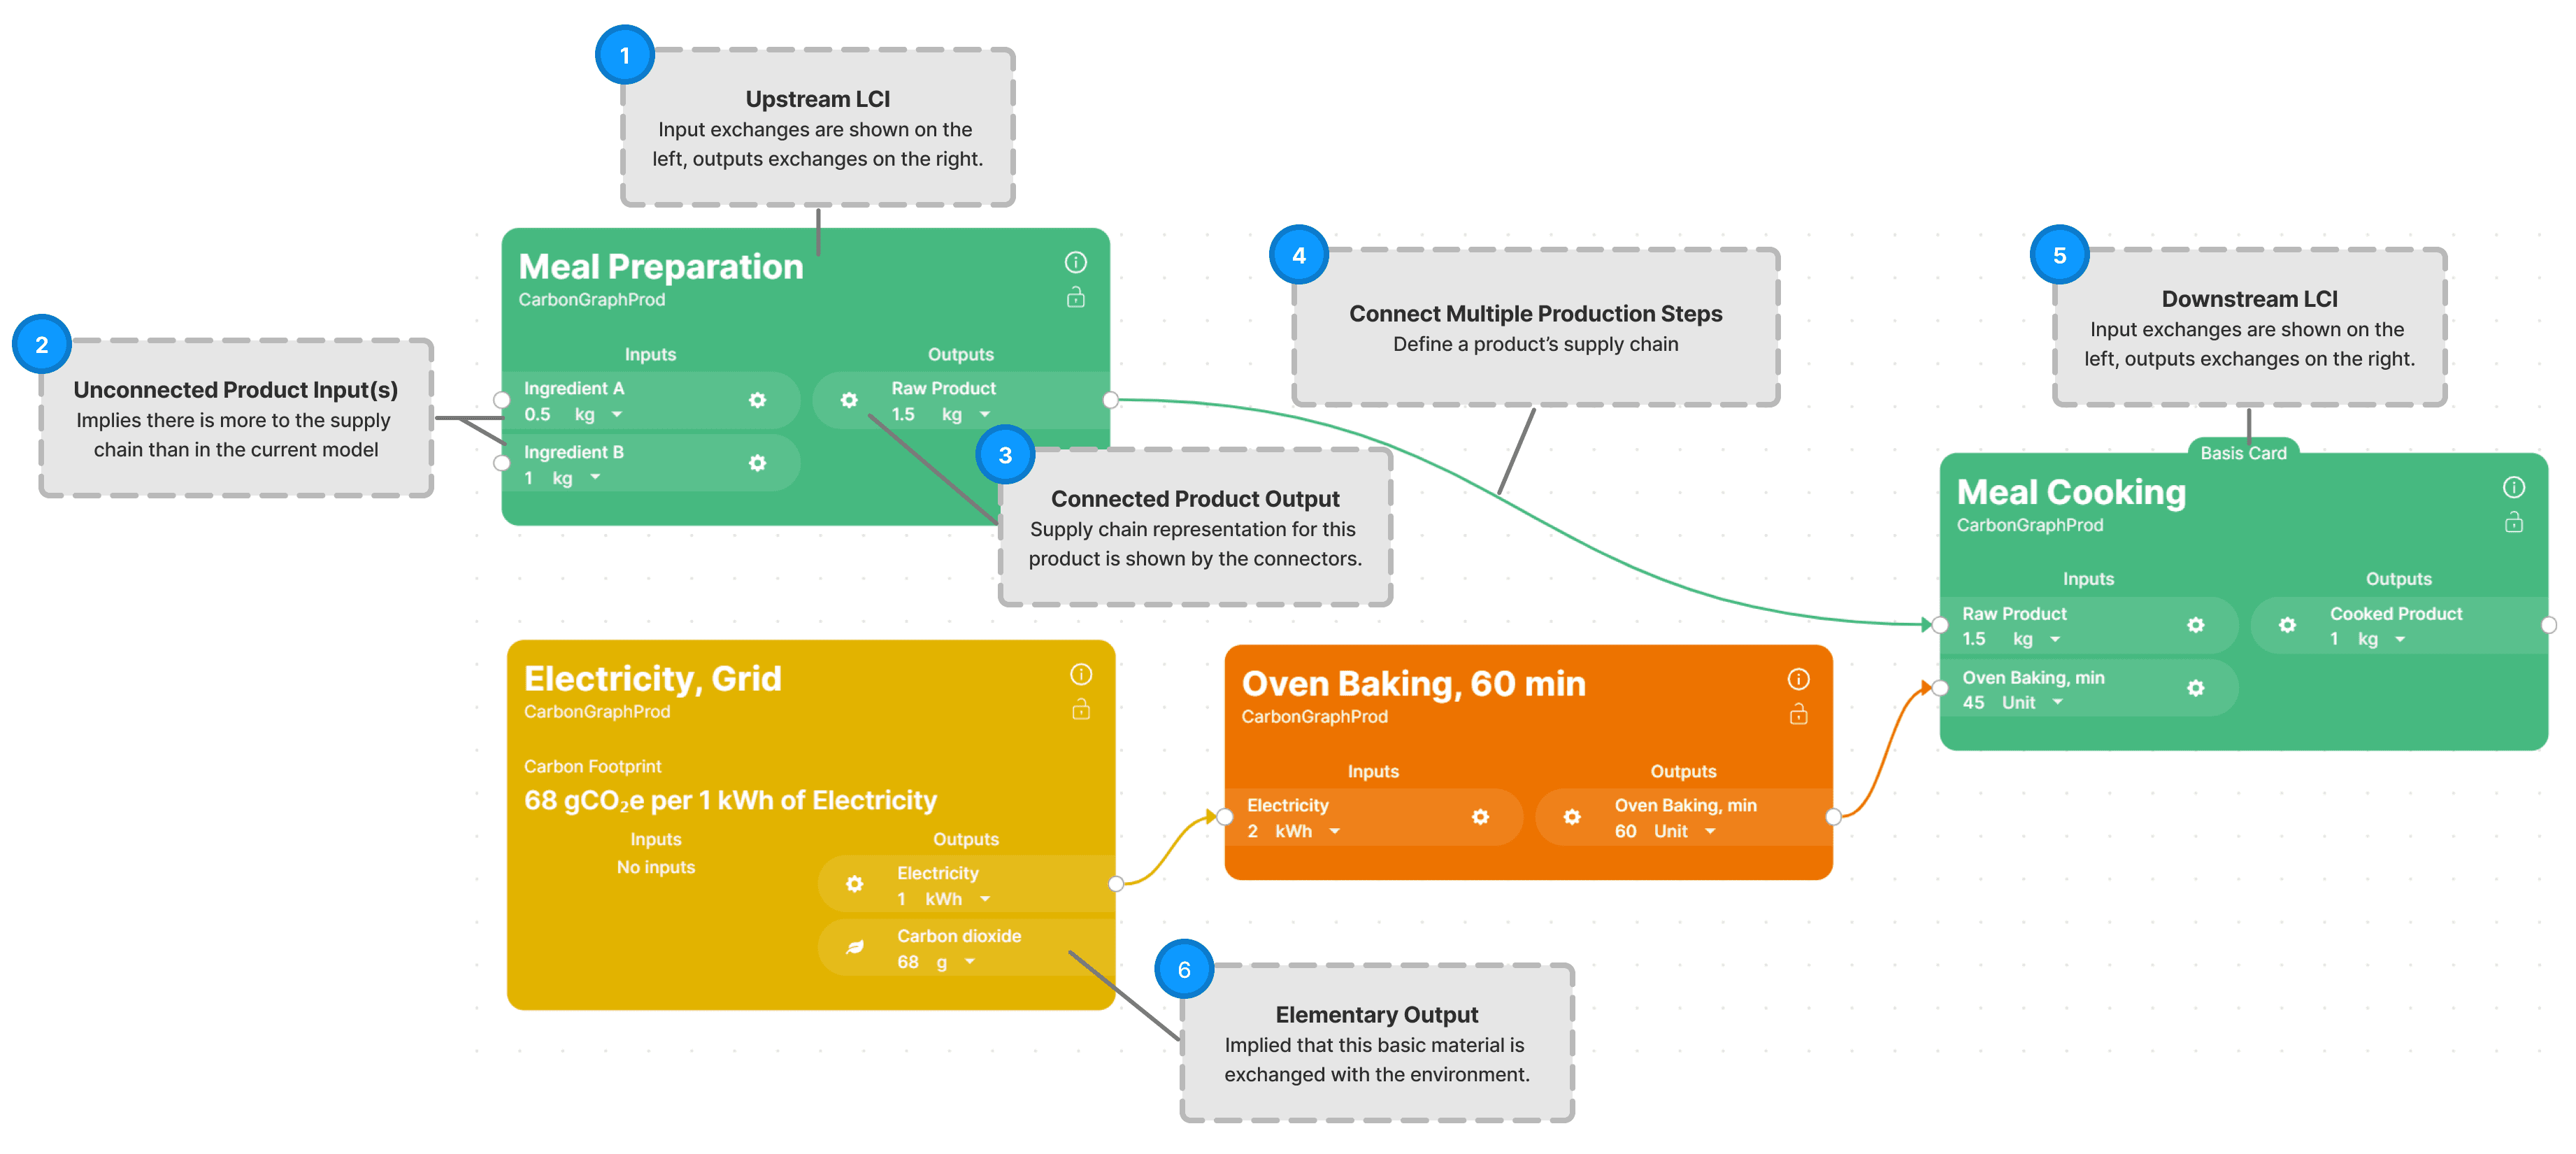
The LCI format in CarbonGraph supports advanced modeling (carbon sequestration, biogenic/non-biogenic emissions, carbon uptake, and more). Those topics are beyond the scope of this intro guide, but they become important in more advanced studies.
How do to model Carbon Offsets or Avoided Emissions?
Carbon offsets and avoided emissions are often used in climate strategies, but it’s important to separate them from the core inventory results.
According to ISO standards, offsets or avoided emissions cannot be directly subtracted from total inventory results. Instead, they may be reported separately as additional information, preserving transparency and comparability of the underlying LCA results.
6
Step 3: Building the Life Cycle Inventory (LCI)
The Life Cycle Inventory (LCI) is the structured list of inputs and outputs for each production step in your model. If the life cycle map is your blueprint, the LCI is the bill of materials and exchanges that make it real.
A useful way to think about LCIs is as “recipes” for production activities. They can be detailed or high-level depending on what you need the model to represent.
Examples:
200g Flour + 100g Water + 5g yeast + 30 min in the Oven = ~200g of Bread
2 units of Laces + 2 units of Unlaced Shoes = 1 pair of Laced Shoes
500 kWh of Electricity + 1 tonne Scrap Metal = 1 tonne of Liquid Steel
Each input and output is an exchange. Exchanges typically fall into two categories: Elementary and Product Exchanges.
What are Elementary Exchanges?
Elementary exchanges are direct flows between the economy and the environment: resources extracted from nature and emissions/waste released back to nature.
Examples: 1 kg of CO₂ emitted to air, or 1000 kg of iron ore extracted.
What are Product Exchanges?
Product exchanges are human-made materials/services exchanged between production steps within the economy (sometimes described as the “technosphere” or “market”).
Examples: butter, grapes, steel plate—processed goods transferred between stages.
How do LCIs of individual activities become a complete LCA?
A full supply chain model is built by connecting LCIs across production steps. The “right” structure depends on the life cycle map created during goal and scope.
CarbonGraph’s LCA editing interface supports this structure with unit conversions and easy linking between LCIs, enabling complex supply chain models.
Example LCI in the CarbonGraph Platform
The LCI format in CarbonGraph supports advanced modeling (carbon sequestration, biogenic/non-biogenic emissions, carbon uptake, and more). Those topics are beyond the scope of this intro guide, but they become important in more advanced studies.
How do to model Carbon Offsets or Avoided Emissions?
Carbon offsets and avoided emissions are often used in climate strategies, but it’s important to separate them from the core inventory results.
According to ISO standards, offsets or avoided emissions cannot be directly subtracted from total inventory results. Instead, they may be reported separately as additional information, preserving transparency and comparability of the underlying LCA results.
7
Step 4: Life Cycle Impact Assessment (LCIA)
In LCIA, inventory data is translated into impact results through a structured relationship between elementary flows, impact factors, impact categories, and characterization models.
Elementary Flows: The Building Blocks of Impact
Elementary flows are the direct exchanges with the environment—materials extracted and emissions released. They are the measurable quantities LCIA uses as inputs.
Impact Factors: Quantifying Environmental Impact
Each elementary flow has an associated impact factor per category—used to convert quantities into comparable impact units.
Example: 1 kg CO₂ emitted contributes 1 kg CO₂e in the Climate Change category.
Impact Categories: Grouping Related Environmental Impacts
Impact categories reflect environmental problems we want to assess, such as climate change or acidification.
Examples of LCIA Impact Categories
Climate Change: potential contribution to global warming (CO₂e)
Ozone Depletion: potential to deplete the ozone layer
Acidification: potential to contribute to acid rain
Resource Depletion: depletion of natural resources
Characterization Models: Frameworks for Impact Assessment
Characterization models define the methods and factors used to evaluate impacts across categories. Different models emphasize different categories and regional assumptions.
Examples of Characterization Models
TRACI (Tool for the Reduction and Assessment of Chemical and Other Environmental Impacts): North America-focused; developed by the U.S. EPA.
ReCiPe: Global model; commonly used in Europe; supports midpoint and endpoint approaches.
CML (Centrum voor Milieuwetenschappen Leiden): Midpoint-focused; strong European foundation.
IMPACT 2002+: Integrates midpoints and endpoints.
ILCD (International Reference Life Cycle Data System): EC guidance and recommended methods.
Calculation Methodology in LCIA
The calculation chain typically looks like:
How Does It All Connect?
Elementary flows: raw environmental exchanges (e.g., 1 kg CO₂)
Impact factors: coefficients translating flows into category impacts
Impact categories: broader issues being assessed
Characterization models: the framework that ensures consistent application
The Summarized LCIA Calculation Steps
Inventory analysis: quantify elementary flows from the LCI
Apply impact factors: convert flows into category results
Aggregate across categories: summarize contributions per category
Integrate (optional): combine categories or convert midpoints to endpoints (where applicable)
By understanding this chain, you can interpret what drives results—and what changes would reduce impacts most effectively.
8
Step 5: Interpretation of Results & Reporting
The final step is interpreting results and communicating them responsibly. Good reporting provides context: what was modeled, what assumptions were made, what data was used, and what limitations exist.
This is also where you validate credibility by demonstrating adherence to core accounting principles: relevance, accuracy, completeness, consistency, and transparency.
Because LCAs serve many audiences, reporting should be tailored so the results are understandable and actionable.
Examples of Audiences for LCA Reports
The Public: readers with little to no experience in LCA
Policymakers: officials and regulators using results to inform decisions
Sustainability Practitioners: technical audiences compiling and comparing studies
External Stakeholders: customers, partners, and others evaluating products
Common LCA Report Contents
Executive Summary: key findings and implications
Recommendations for Action: decisions supported by results
Visual Representation of Data: charts and diagrams that clarify findings
Uncertainty Analysis: how assumptions and variability affect conclusions
Comparative Analysis: benchmarking or comparison with prior work (when appropriate)
Detailed Appendices: methodological notes and inventories for technical audiences
Stakeholder Feedback: how engagement informed scope or interpretation
Example Disclaimer Text
“The results presented in this report are unique to the assumptions and practices of company X. The results are not meant as a platform for comparability to other companies and/or products. Even for similar products, differences in unit of analysis, use and end-of-life stage profiles, and data quality may produce incomparable results. The reader may refer to the additional resources for a glossary and additional insight into the LCA reporting process.”
CarbonGraph strives to create a flexible platform that can be used for any reporting framework.
9
Concluding Remarks
Thank you for exploring our beginner's guide to Life Cycle Assessment (LCA). We hope this introduction has given you a practical foundation for understanding what LCA is, how it works, and why it’s useful.
For deeper insights into LCA methodology, explore these external resources:
ISO 14040 - Life cycle assessment Principles and framework — https://www.iso.org/standard/37456.html
ISO 14044 - Life Cycle Assessment Requirements and Guidelines — https://www.iso.org/standard/38498.html
ISO 14067 - Greenhouse gases Carbon footprint of products — https://www.iso.org/standard/71206.html
ISO 14025 - Environmental labels and declarations — https://www.iso.org/standard/38131.html
GHG Protocol - Product Life Cycle Accounting and Reporting Standard — https://ghgprotocol.org/sites/default/files/standards/Product-Life-Cycle-Accounting-Reporting-Standard_041613.pdf
U.S. General Services Administration - Life Cycle Assessment Overview — https://sftool.gov/plan/400/life-cycle-assessment
Attributional and Consequential Life Cycle Assessment — https://www.intechopen.com/chapters/69212
If you have any questions, feedback, or suggestions, please don’t hesitate to contact us at support@carbongraph.io. Your insights are invaluable to us, and we’re always eager to improve our platform and resources to better serve your needs.
Ready to prove your sustainability advantage?
We'll build your first model with you.
Ready to prove your sustainability advantage?
We'll build your first model with you.
Ready to prove your sustainability advantage?
We'll build your first model with you.