Beyond Reporting: What PNW Climate Week Taught Me About the Sustainability Data Maturity Curve
Author:
Alex Crease
Most manufacturers do not get stuck on sustainability data because they lack ambition. They get stuck because nobody has laid out what actually comes next after the first carbon estimate, and because even a technically correct model does nothing if the people who need to act on it cannot read it.
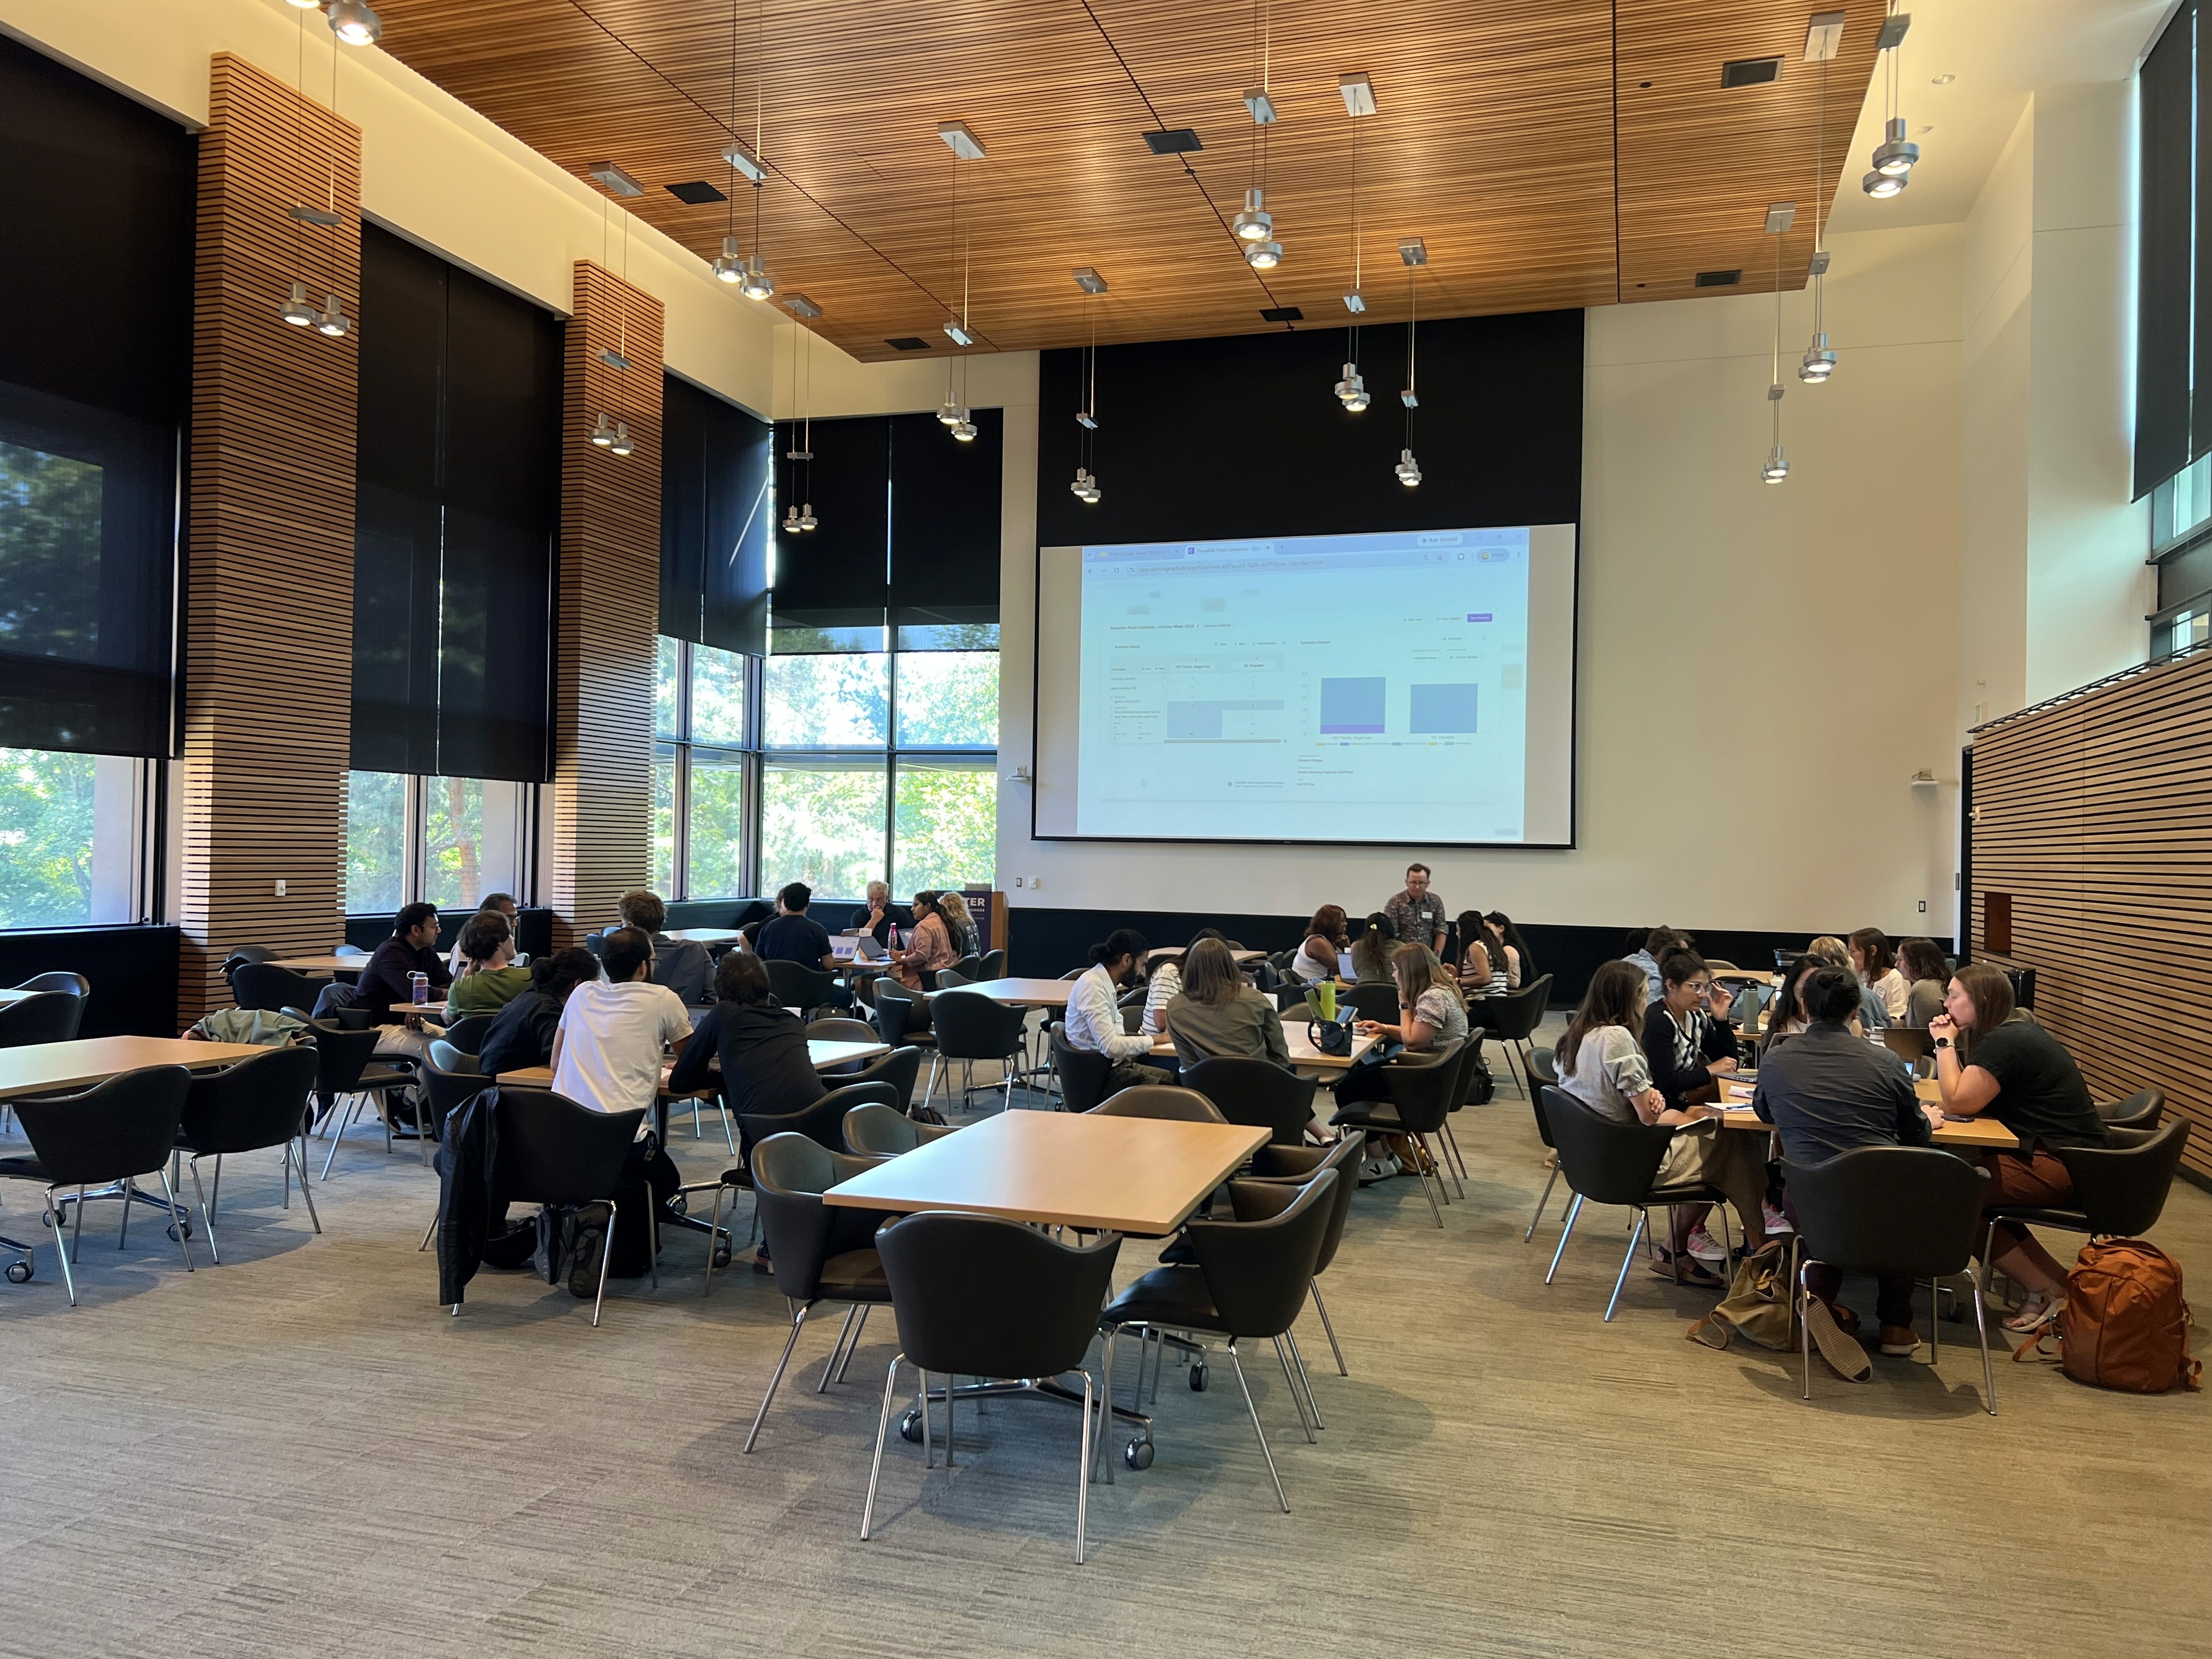
Last month I hosted a panel at the University of Washington's Foster School of Business as part of PNW Climate Week, alongside Priscila Carrijo, Stacy Smedley, and Christian Carron, on "Beyond Reporting: Using Sustainability Data to Build Trust, Drive Decarbonization, and Win Business." A day later, I ran a hands-on Life Cycle Assessment (LCA) workshop with a different group. Between the two, a clear picture emerged of where companies get stuck on their sustainability data journey, and where the industry still has work to do.
Why Companies Start Broad Before They Start Precise
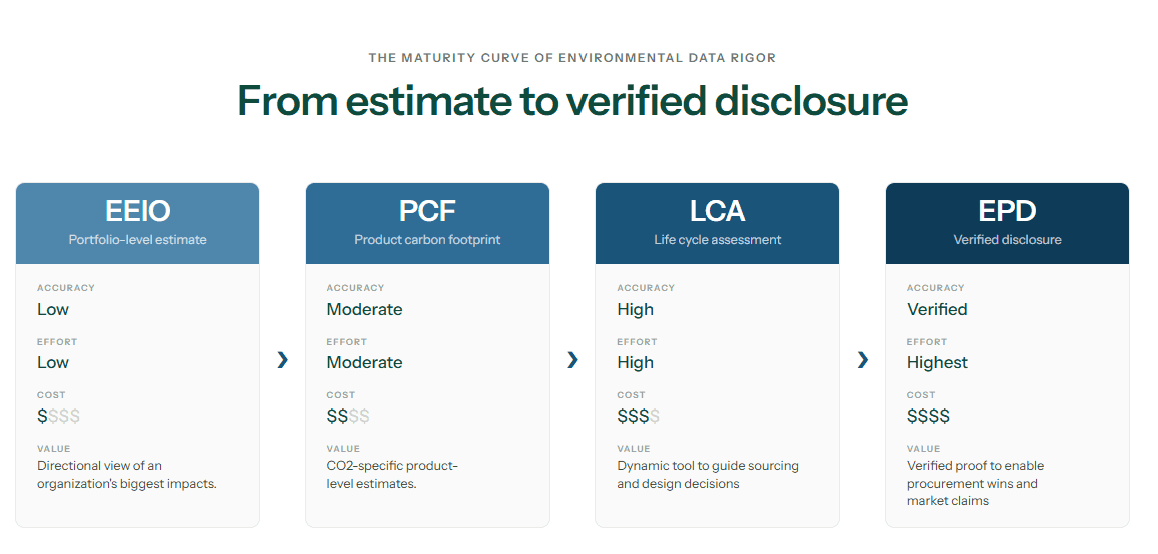
Companies don't begin their sustainability data journey with an LCA. They begin with something much broader: portfolio-level estimates using EEIO (Environmentally-Extended Input-Output) data, or general GHG accounting. These methods trade accuracy for speed, and at this stage, that's the right trade. The goal isn't precision. It's finding the hotspots: which product line, facility, or supply chain segment concentrates the impact. Answering that doesn't require a perfect model. It requires enough data to point in the right direction.
Once a hotspot is identified, the next step up is usually a Product Carbon Footprint (PCF): a single-product, carbon-only estimate that's faster to produce than a full LCA but far more specific than a portfolio-level EEIO number. A PCF gives a company a defensible figure for one product without yet committing to the full rigor, or cost, of a multi-category life cycle model.
Only once that more targeted view justifies the investment does it typically make sense to build out a full LCA, and eventually an Environmental Product Declaration (EPD). Each step up costs more, in both data collection effort and verification rigor, but it also buys more credibility and more specificity about what to actually fix.
Broad, directional claims get a company oriented. They don't hold up under scrutiny. Precision has to be earned in stages, not skipped to.
That progression, from EEIO-level estimates, to a product-level carbon footprint, to a full LCA, to a third-party-verified EPD, is the sustainability data maturity curve, and it came up repeatedly on the panel as the throughline that separates companies who make credible claims from companies who make claims that later get walked back.
What a "Compelling Event" Does to a Supply Chain
A phrase that stuck with me from the panel was "compelling event": the moment a large market player becomes financially, not just reputationally, committed to a sustainability pledge.
Once a company of significant size makes a public, quantified pledge, walking it back isn't just a communications problem. It can carry real financial and legal exposure. That changes the incentive structure entirely. The company now has a strong reason to actually hit the target, and the most effective way to do that is to push the requirement down through its supplier base. Sustainability data stops being a nice-to-have for hundreds of upstream vendors and becomes a condition of doing business.
There's also a regulatory pattern worth noting. Government requirements ebb and flow with the administration in power, but large corporations often make their boldest pledges during climate-forward political windows and then stay committed to them even after regulatory support is rolled back. The compelling event, once triggered, doesn't get undone by an election cycle. That makes it a more durable adoption driver than regulation on its own, and one reason product-level carbon data keeps showing up in procurement requirements regardless of what's happening in Washington or Ottawa in any given year.
How Building an EPD Becomes a Diagnostic, Not Just a Deliverable
Here's an insight from the panel that I think is underappreciated: for a lot of organizations, the EPD isn't just the destination. It's the moment they finally learn their actual hotspots.
It's tempting to think of the LCA-to-EPD process as one-directional: build a model, get it verified, publish a disclosure, done. But several panelists made the point that in practice, the process of building a rigorous, third-party-verified EPD often surfaces insights a company didn't have before. Those insights feed back into product design, materials sourcing, and manufacturing decisions. The disclosure becomes the diagnostic tool.
That reframes the value proposition. An EPD isn't only proof for a customer or regulator. For many teams, it's the first time they've had a model rigorous enough to actually see, and act on, where their impact lives.
The Importance of Interpretability
The last thread from the panel doesn't get talked about enough: traceability, data aggregation, and what one panelist called interpretability, meaning whether someone without an LCA background can actually understand what the numbers mean.
This is exactly the tension I ran into the next day at the workshop. A few things stood out.
Scenario analysis is a great entry point for newcomers. Rather than asking participants to build an LCA model from scratch, we had them explore pre-built scenarios instead: "what happens if you change this input?" That gave people the freedom to experiment without worrying about doing it wrong, and it led to real conversations about what a material substitution or process change would actually mean for the outcome. The fastest way to build confidence with LCA isn't to start with modeling. It's to start with decisions.
LCA is inherently nuanced, and the tooling should be designed for that, not around hiding it. Life cycle models carry a lot of "it depends" by nature: assumptions, boundaries, and data sources all shape the result. The goal isn't to hide that nuance. It's to make it navigable, so someone can get a clear, defensible answer without becoming a methodology expert first.
Visualizing a model matters as much as building it. Participants gravitated strongly toward a Sankey-style flow view of impacts, and it did the most work in making results click for people who don't work in LCA day to day. The most common request was to see that same Sankey view update dynamically as scenarios are applied, so people can watch a decision's impact play out visually instead of reading it off a table.
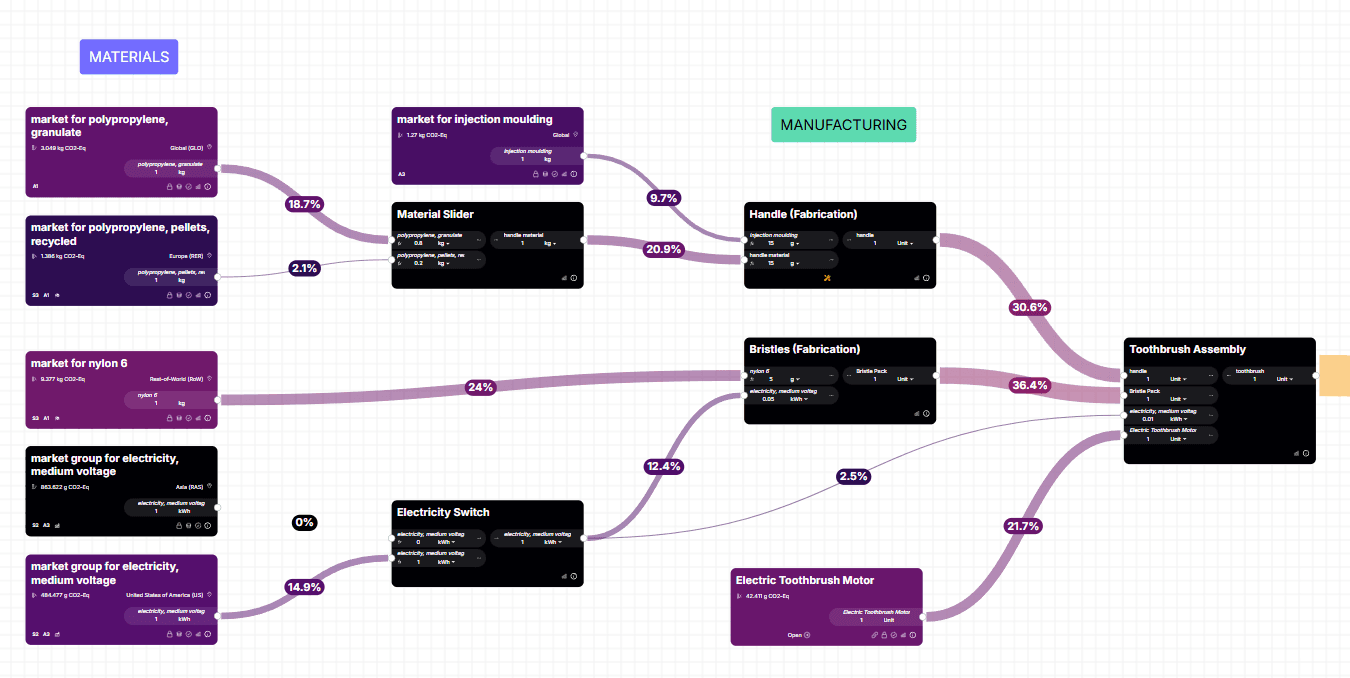
The Sankey view of a toothbrush LCA modeled in CarbonGraph
Why This Matters for Where Your Company Sits on the Curve
The panel and the workshop reinforced the same idea from two directions. On the panel, we talked about how organizations move up a maturity curve, from directional claims to verified, granular disclosures, and how that progression is driven as much by market dynamics (compelling events, procurement pressure) as by regulation. In the workshop, I watched the same tension play out: people want the rigor and granularity that real LCA modeling provides, but they need it presented in a way that doesn't require becoming an LCA expert first.
That's the balance sustainability teams are actually managing day to day: enough depth and control to produce a defensible, verifiable model, without requiring every product engineer, sustainability lead, or procurement analyst to become a lifecycle assessment specialist to get value from it. Based on what I heard this week, interpretability may be the single factor that determines whether an organization makes it up the maturity curve at all, not just how sophisticated its underlying model is.
A Better Way to Approach the Climb
This is the problem CarbonGraph is built to solve. CarbonGraph is a next-generation LCA platform that helps organizations move from product data to verified environmental disclosures in a single, structured workflow, built around process flow modeling instead of spreadsheet-based setups. It structures product and manufacturing data in one place, builds defensible lifecycle models aligned to PCRs, and generates documentation as the model is built, so the path from a directional estimate to a verified EPD doesn't require rebuilding your data foundation at every stage. And because the platform is designed around visual, interpretable models rather than static reports, the same interpretability problem the workshop surfaced is one it's built to address directly.
Ready to see where your product sits on the maturity curve? We'll help you find your hotspots first, then build the model to prove it. Get in touch to get started on your EPD journey.
Thanks again to Christian, Priscila, and Stacy for such a thoughtful discussion, and to everyone who came out for the events.