Impact Insight: A Study of Single Use vs. Reusable Meal Containers
In an age of growing environmental concern, even the smallest choices – like our meal containers – can contribute to a more sustainable future. This life cycle assessment (LCA) delves into the environmental impacts of a reusable meal container throughout its entire lifespan, from raw material extraction to disposal or recycling.
Key Objectives:
- Conduct a high-level assessment of the environmental impacts of a reusable meal container over its lifecycle with two usage scenarios (single use and 1,000 re-uses).
- Contrast the environmental performance of single use versus 1,000 use scenarios to highlight the potential benefits of reusability
- Provide data-driven insights to guide consumers, manufacturers, and policymakers towards more sustainable practices.
Methodology
This assessment adheres to the ISO 14040 LCA principles. The model was built utilizing CarbonGraph's advanced cloud-based LCA platform. No third-party review was conducted on the Life Cycle Inventory (LCI) or Life Cycle Impact Assessment (LCIA) results. Secondary reference data was obtained from the Ecoinvent dataset (v3.9.1 Allocation-Cut-Off-By-Classification). The impact assessment utilized the ReCiPe 2016 Midpoint (H) characterization model.
This was a high-level study, and the results are contingent upon the specific data and assumptions employed. As such, these findings may not be universally applicable across different contexts. Users should carefully consider the study's context and limitations before making any decisions based on its results. The study is intended to provide a preliminary understanding rather than definitive conclusions, and further detailed assessments may be necessary for comprehensive evaluations.
Life Cycle Assessment (LCA) Framework
LCA is a systematic analysis of the environmental impacts associated with a product throughout its entire life cycle. From raw material extraction to end-of-life disposal. The LCA methodology allows us to:
- Quantify Impacts: Measure the container's environmental impact in terms of carbon dioxide emissions, energy use, and other relevant indicators.
- Identify Hotspots: Pinpoint the stages of the life cycle where the container's environmental impact is most significant.
- Inform Decision-Making: Provide data-driven insights for consumers, manufacturers, and policymakers to make informed choices that promote sustainability.
The CarbonGraph Advantage
CarbonGraph’s cloud-based platform streamlines the assessment process and offers powerful features for data collection, modelling, and reporting. By harnessing this technology, we can:
- Trace the Supply Chain: Follow the container's journey from raw material extraction to end-of-life, accounting for all inputs and outputs.
- Access Comprehensive Data: Utilize extensive databases of environmental impact information to ensure the accuracy and completeness of our analysis.
- Visualize Results: Generate clear and intuitive graphs and charts that effectively communicate the container's environmental footprint.
Ultimately the CarbonGraph platform reduces the time and effort required to produce a life cycle assessment model. Freeing practitioners to allocate more time to high-value activities like building insight from the models, developing action plans, and communicating results with stakeholders.
Goal and Scope Definition
The objective of this study is to assess at a high-level the environmental impacts of a reusable meal container over its life cycle in two usage scenarios: single use and 1,000 re-uses.
System Boundary:
The entire life cycle, including material acquisition and production, transportation, use (cleaning), and end-of-life.
Functional Unit:
The functional unit is defined as a single use of a plastic reusable meal container.
Scenarios:
- Single use: The container is used once and then disposed of.
- 1,000 uses: The container is reused 1,000 times before disposal.
Life Cycle Inventory
Materials Acquisition and Production
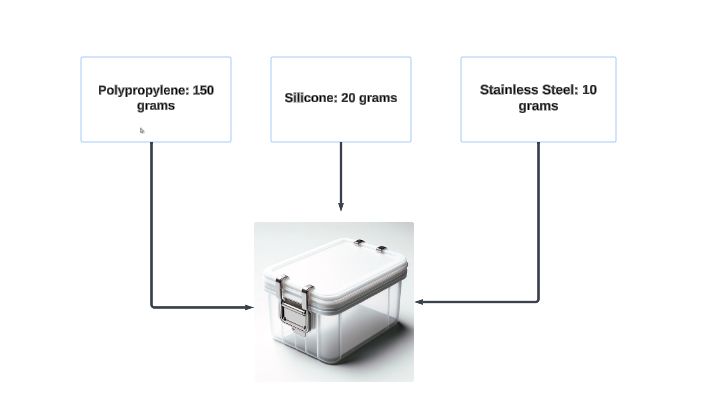
To produce one reusable meal container, the following materials and quantities will be used:
- Polypropylene: 150 grams
- Silicone: 20 grams
- Stainless Steel: 10 grams
The diagram below illustrates the container's components, along with the materials and their respective quantities.
Extraction and Processing
Polypropylene (PP):
- Extraction: Crude oil is primarily extracted in the Middle East, Russia, or the USA.
- Processing: Oil is refined and processed into polymers in chemical plants possibly in regions like China, the USA, or Germany.
Silicone:
- Extraction: Derived from silica, extracted from quartz, sandstone, or other silicon-rich materials, likely in Australia or the USA.
- Processing: Processed into silicone in chemical plants, potentially in China, the USA, or Germany.
Stainless Steel:
- Extraction: Iron ore, chromium, nickel mined in countries like China, Russia, Brazil.
- Processing: Steel mills and processing plants likely in China, India, or Japan.
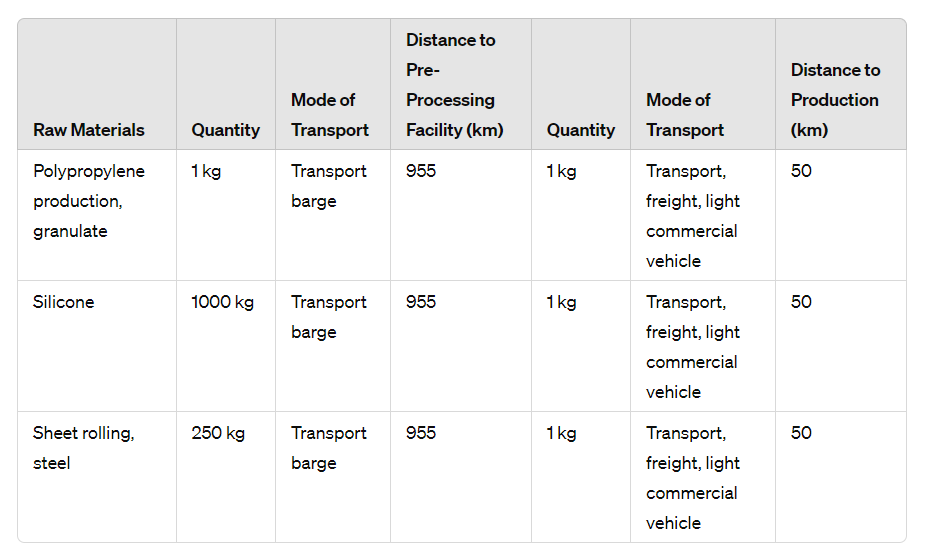
Transportation of Raw Materials
This table details the transportation of raw materials from their extraction points, first to pre-processing facilities and then to final production facilities. It includes distances travelled and modes of transport utilized for each stage. This comprehensive transportation data is crucial for accurately calculating the container's Life Cycle Impact Assessment (LCIA), ensuring a thorough accounting of all inputs and outputs throughout its journey from raw material to end-of-life.
Manufacturing
The following table provides a bill of materials (BOM) for the production of a single reusable meal container, specifying the types and quantities of polypropylene, stainless steel (latch), and silicone (seal) components.
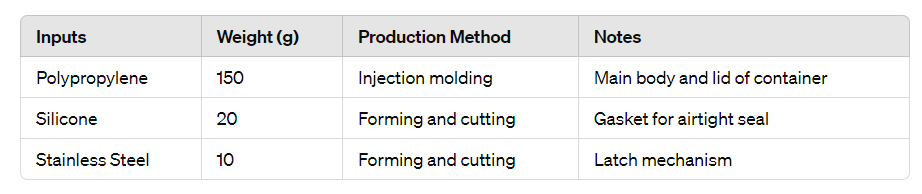
The assembly of the reusable meal container takes place in China, leveraging the region's well-developed manufacturing infrastructure and cost advantages. The manufacturing process involves:
- Injection Molding: Used to create the polypropylene body and lid of the container.
- Forming and Cutting: Used to shape and size the stainless-steel latch mechanism and silicone seal.
- Energy Consumption: The average electricity consumption during the production of one meal container is estimated at 0.2 kilowatt-hours (kWh).
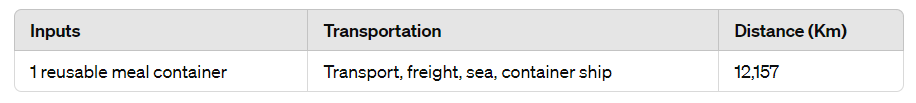
Transportation
The next phase in our product's life cycle involves transportation from the production facilities in China to the retail market in the USA. This stage encompasses the logistical movement of the finished meal containers across a considerable distance, utilizing primarily maritime shipping.
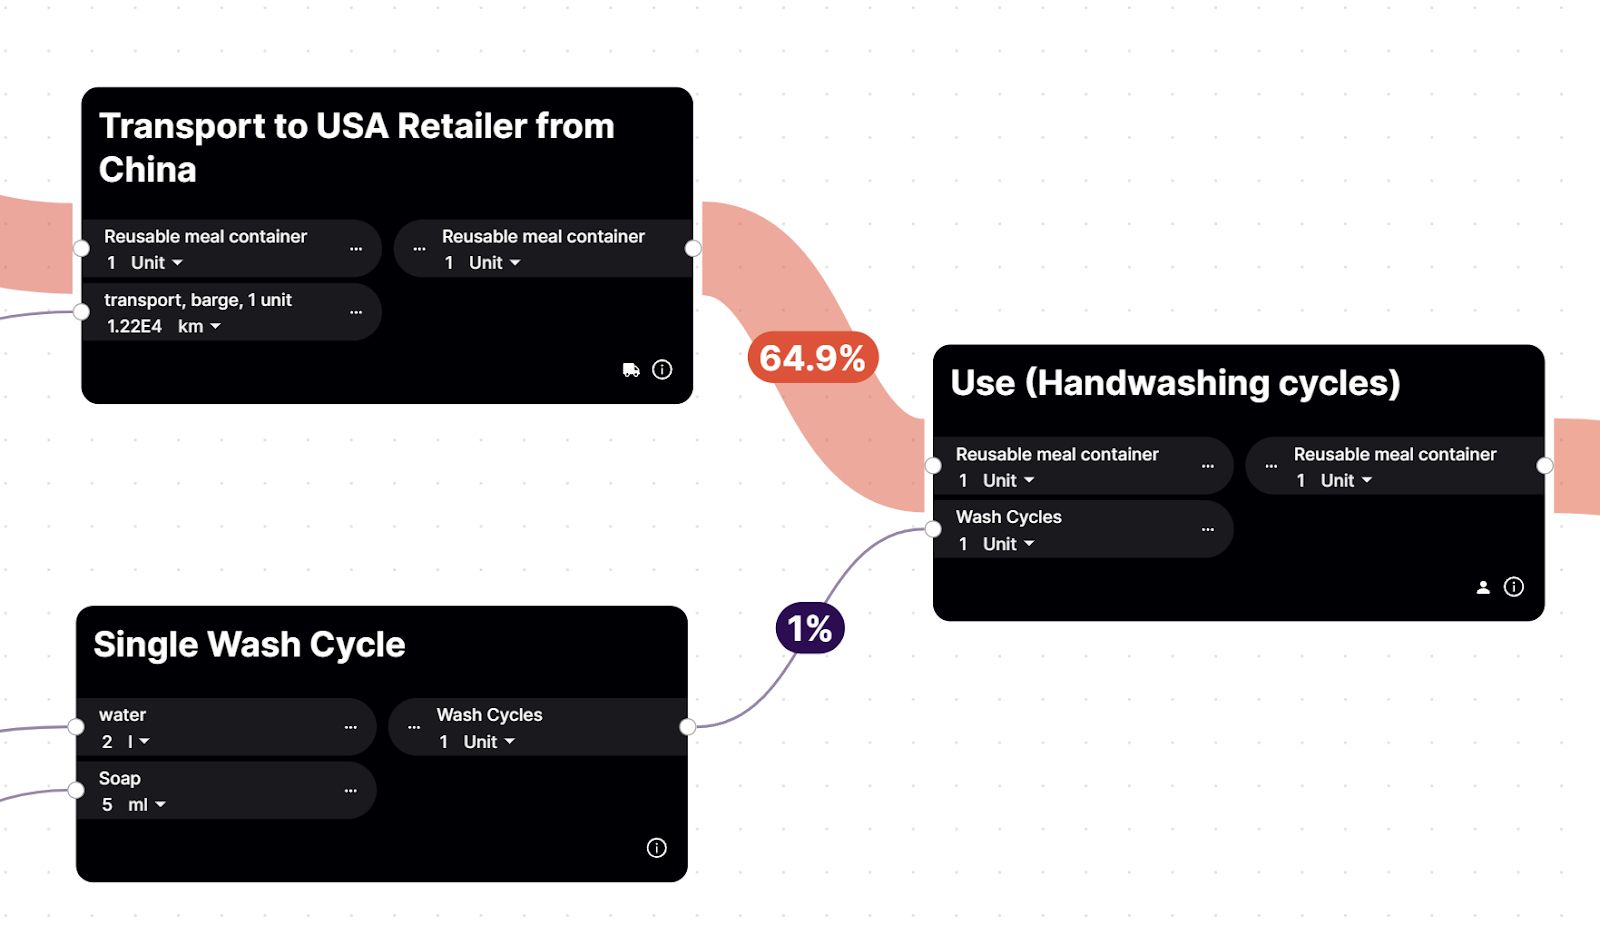
Cleaning Process
Now that our reusable meal container is in the consumer's hands, it's essential to evaluate the environmental impact of its use phase, specifically handwashing. We'll focus on a typical scenario: washing the container with 2 liters of cold water and 5 ml of Dawn liquid soap (0.932 g/cm³). This analysis is crucial for understanding the cumulative impact of handwashing across both our single-use and 1,000-use scenarios
End-of-Life
The end-of-life stage for our reusable container involves transporting its components to appropriate recycling or disposal facilities. In this scenario, we assume that the polypropylene and stainless-steel components are recyclable, while the silicone gasket is not and will be landfilled.
The table below details the transportation methods and distances involved in moving the recyclable materials to their respective destinations.

Results
After modelling the entire life cycle of a reusable meal container in CarbonGraph, we investigate the hot spots and sensitivities of the model to build intuition about the environmental footprint across the two scenarios. Within CarbonGraph there are many different views into the impacts of your model. We will be highlighting only a few points in this report.
The image illustrates the complete lifecycle of a reusable container, detailing each phase from raw material acquisition to end-of-life. It encompasses the entire production, usage, and disposal process, providing a comprehensive overview of how reusable containers are managed throughout their lifecycle.

A single use scenario shows a lower immediate impact per use, but as the number of uses increases to 1000, the impact distribution shifts, highlighting the significance of cleaning resources (water and soap).
Single-Use Scenario:
In the single-use scenario, the total carbon footprint of the meal container was 1.3 kg CO2-Eq for the entire life cycle or 1.3 kg CO2-Eq per use.

This impact was primarily driven by:
- Material Production (Polypropylene): The production of the polypropylene granulates used in the container accounted for 27% of the total impact, highlighting the significance of material choices in product sustainability.
- End-of-Life Processing: The market for waste polypropylene, representing the end-of-life processing of the material, contributed 20%, underscoring the environmental cost of waste management.
- Manufacturing and Transportation: Injection molding (17%) and various transportation phases collectively constituted a significant portion of the impact, reflecting the energy and emissions associated with production and global supply chains.
1,000-Uses Scenario:
With 1,000 uses, the total carbon footprint rose to 14 kg CO2-Eq for the entire life cycle or 0.014 kg CO2-Eq per use. On a per-use basis this is equivalent to a 99% reduction in emissions compared to the single-use scenario.
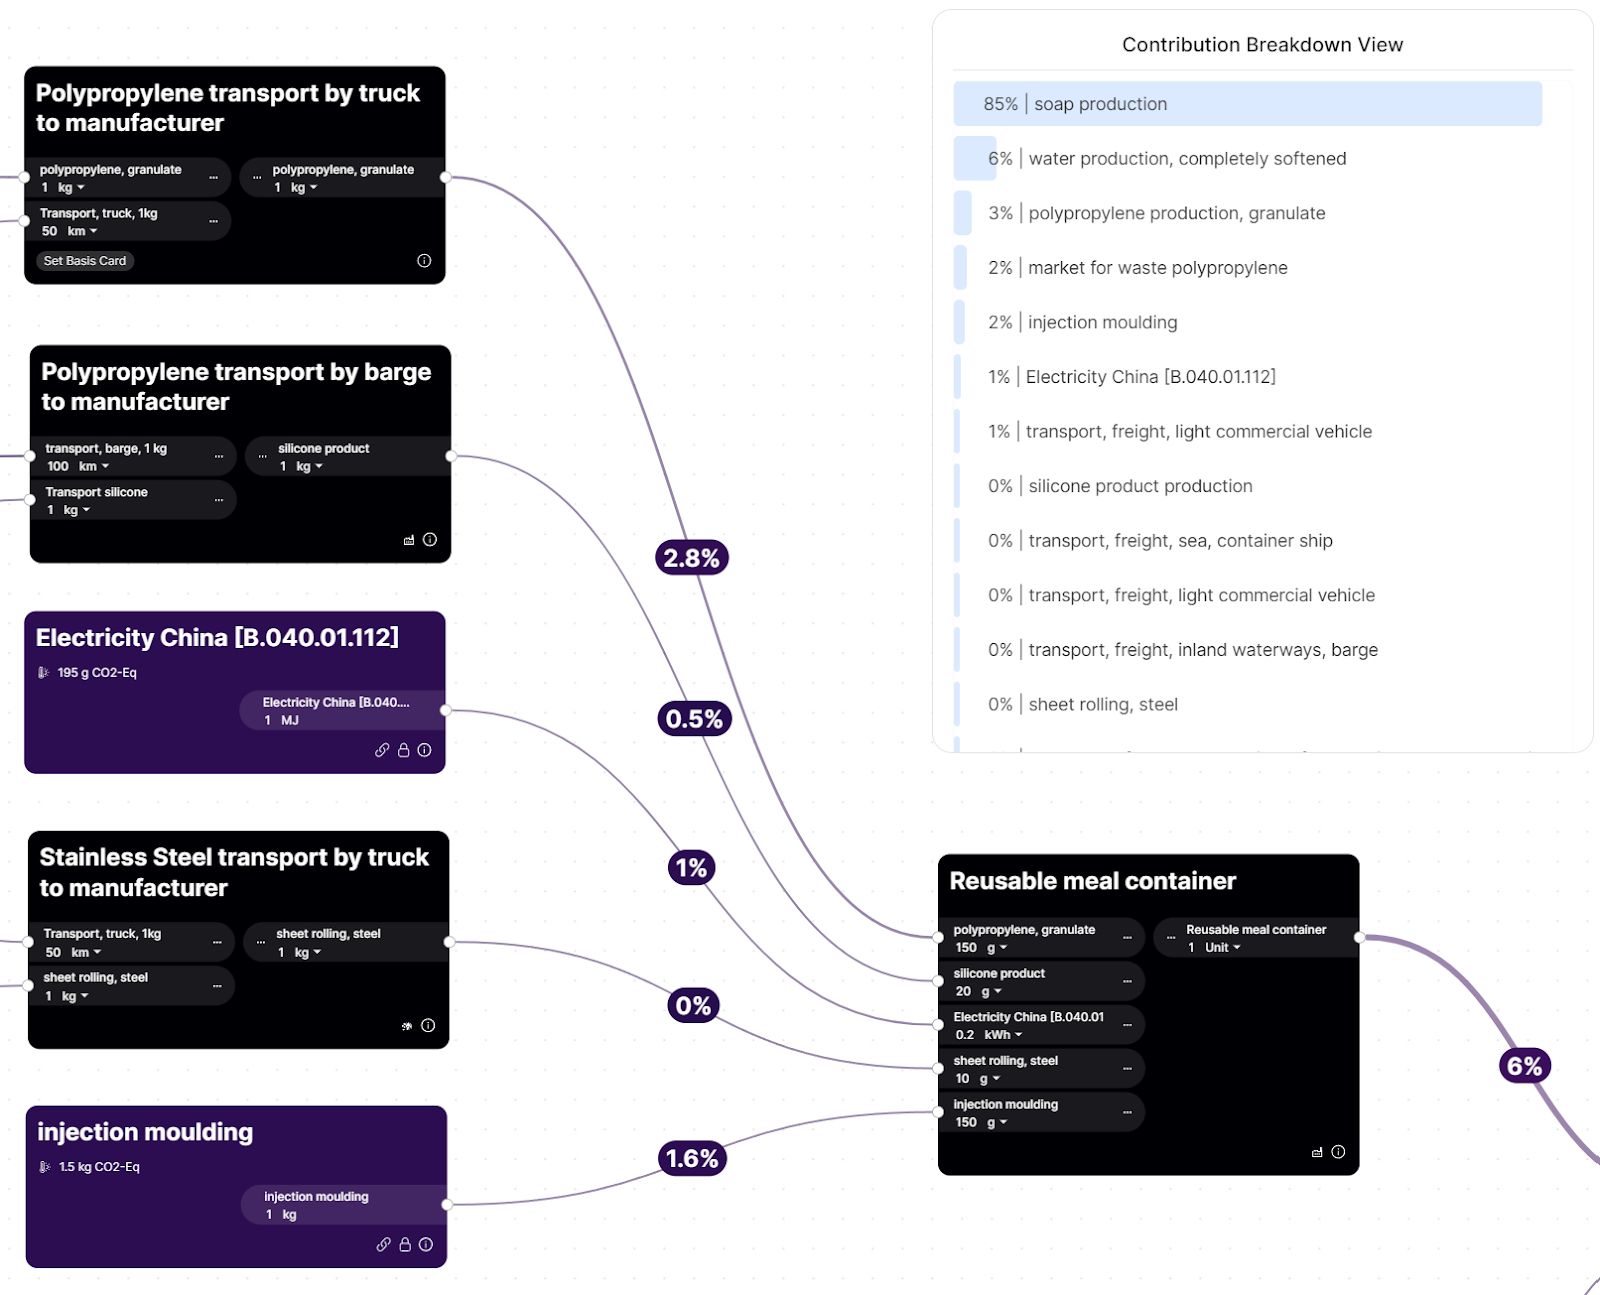

However, the breakdown of contributing factors shifted dramatically:
- Soap Production: The most substantial contributor (85%) was soap production, highlighting the cumulative impact of repeated cleaning on the overall environmental footprint.
- Water Use: Water production accounted for 6%, emphasizing the importance of water conservation in cleaning practices.
- Material Production and Transportation: The impacts from polypropylene production, transportation, and other initial phases became relatively negligible (3% or less), as they were amortized over the extended lifespan of the container.
Key Takeaways
- Reusability Benefits: While the absolute carbon footprint increased with more uses, the environmental impact per use decreased significantly. This is because the initial impacts of production and transportation are spread over a larger number of uses. The LCA results demonstrate the nuanced nature of reusability. While a single-use scenario has a lower upfront environmental impact, the impact per use plummets dramatically with increased reuse.
- Washing Practices Matter: The dominance of soap production in the 1,000 uses scenario underscores the importance of using eco-friendly soaps and optimizing washing practices to minimize environmental impact.
- Material Selection: While polypropylene production is a significant factor in the single-use scenario (27%), its impact diminishes rapidly with each reuse. This demonstrates that the initial embodied energy of a reusable product becomes less relevant with extended use. Additionally, the significance of polypropylene production in the single-use scenario underscores the importance of considering the environmental impact of materials throughout their lifecycle when designing reusable products.
The LCA of the reusable meal container reveals a compelling case for Reusability as a sustainable strategy. By adopting best practices for material selection, cleaning, and disposal, we can significantly reduce the environmental impact of our food consumption habits. This analysis underscores the importance of a holistic approach that considers the entire life cycle of a product and empowers stakeholders to make informed choices that contribute to a more sustainable future.
Share
Got a Product in Mind? Let's Model It Together.
Tell us what you're working on, and we'll show you how CarbonGraph can bring it to life with environmental insights.